U.S. Virgin Islander vs Immigrants from Southern Europe Associate's Degree
COMPARE
U.S. Virgin Islander
Immigrants from Southern Europe
Associate's Degree
Associate's Degree Comparison
U.S. Virgin Islanders
Immigrants from Southern Europe
42.1%
ASSOCIATE'S DEGREE
0.7/ 100
METRIC RATING
250th/ 347
METRIC RANK
47.8%
ASSOCIATE'S DEGREE
84.4/ 100
METRIC RATING
140th/ 347
METRIC RANK
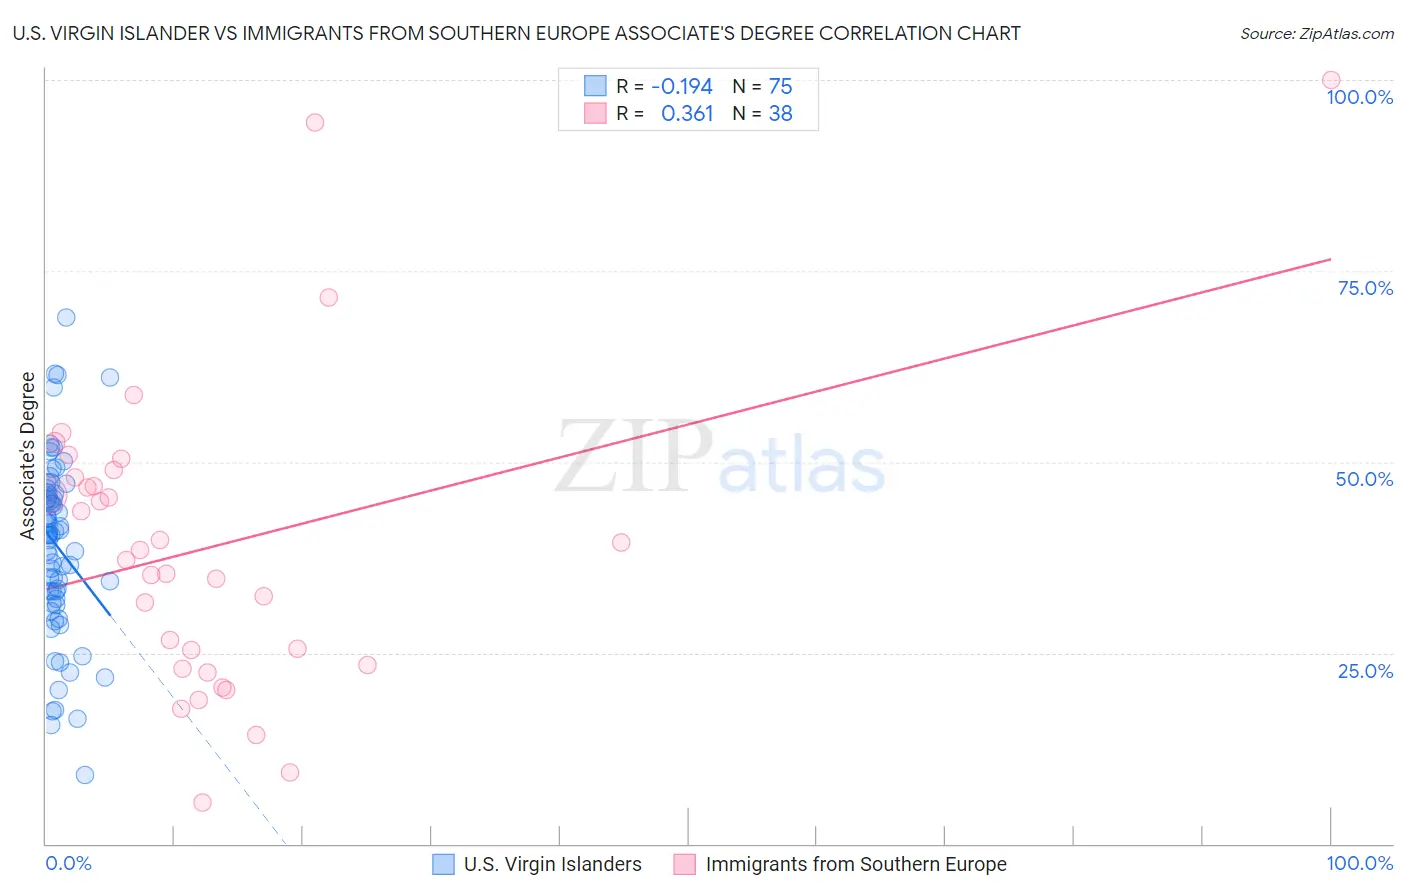
U.S. Virgin Islander vs Immigrants from Southern Europe Associate's Degree Correlation Chart
The statistical analysis conducted on geographies consisting of 87,527,119 people shows a poor negative correlation between the proportion of U.S. Virgin Islanders and percentage of population with at least associate's degree education in the United States with a correlation coefficient (R) of -0.194 and weighted average of 42.1%. Similarly, the statistical analysis conducted on geographies consisting of 402,795,863 people shows a mild positive correlation between the proportion of Immigrants from Southern Europe and percentage of population with at least associate's degree education in the United States with a correlation coefficient (R) of 0.361 and weighted average of 47.8%, a difference of 13.6%.
Associate's Degree Correlation Summary
| Measurement | U.S. Virgin Islander | Immigrants from Southern Europe |
| Minimum | 9.0% | 5.4% |
| Maximum | 68.9% | 100.0% |
| Range | 59.9% | 94.6% |
| Mean | 38.9% | 38.9% |
| Median | 40.4% | 37.8% |
| Interquartile 25% (IQ1) | 32.1% | 23.3% |
| Interquartile 75% (IQ3) | 45.9% | 48.0% |
| Interquartile Range (IQR) | 13.8% | 24.7% |
| Standard Deviation (Sample) | 11.6% | 20.1% |
| Standard Deviation (Population) | 11.5% | 19.9% |
Similar Demographics by Associate's Degree
Demographics Similar to U.S. Virgin Islanders by Associate's Degree
In terms of associate's degree, the demographic groups most similar to U.S. Virgin Islanders are Jamaican (42.1%, a difference of 0.010%), Immigrants from Bahamas (42.1%, a difference of 0.020%), Immigrants from Ecuador (42.2%, a difference of 0.16%), Immigrants from Fiji (42.2%, a difference of 0.24%), and Delaware (42.3%, a difference of 0.33%).
| Demographics | Rating | Rank | Associate's Degree |
| Guyanese | 1.0 /100 | #243 | Tragic 42.3% |
| Immigrants | Liberia | 0.9 /100 | #244 | Tragic 42.3% |
| Immigrants | Cambodia | 0.9 /100 | #245 | Tragic 42.3% |
| Delaware | 0.9 /100 | #246 | Tragic 42.3% |
| Immigrants | Fiji | 0.8 /100 | #247 | Tragic 42.2% |
| Immigrants | Ecuador | 0.8 /100 | #248 | Tragic 42.2% |
| Jamaicans | 0.7 /100 | #249 | Tragic 42.1% |
| U.S. Virgin Islanders | 0.7 /100 | #250 | Tragic 42.1% |
| Immigrants | Bahamas | 0.7 /100 | #251 | Tragic 42.1% |
| French American Indians | 0.6 /100 | #252 | Tragic 42.0% |
| Indonesians | 0.6 /100 | #253 | Tragic 41.9% |
| Cubans | 0.6 /100 | #254 | Tragic 41.9% |
| Immigrants | Guyana | 0.5 /100 | #255 | Tragic 41.8% |
| Immigrants | Congo | 0.5 /100 | #256 | Tragic 41.8% |
| Spanish Americans | 0.5 /100 | #257 | Tragic 41.8% |
Demographics Similar to Immigrants from Southern Europe by Associate's Degree
In terms of associate's degree, the demographic groups most similar to Immigrants from Southern Europe are Slovene (47.9%, a difference of 0.090%), Taiwanese (47.7%, a difference of 0.15%), Sierra Leonean (47.7%, a difference of 0.20%), Norwegian (47.6%, a difference of 0.43%), and Polish (48.0%, a difference of 0.44%).
| Demographics | Rating | Rank | Associate's Degree |
| Assyrians/Chaldeans/Syriacs | 89.4 /100 | #133 | Excellent 48.2% |
| Moroccans | 89.3 /100 | #134 | Excellent 48.2% |
| Europeans | 89.0 /100 | #135 | Excellent 48.2% |
| Pakistanis | 88.0 /100 | #136 | Excellent 48.1% |
| Immigrants | Eritrea | 87.8 /100 | #137 | Excellent 48.1% |
| Poles | 87.3 /100 | #138 | Excellent 48.0% |
| Slovenes | 85.1 /100 | #139 | Excellent 47.9% |
| Immigrants | Southern Europe | 84.4 /100 | #140 | Excellent 47.8% |
| Taiwanese | 83.3 /100 | #141 | Excellent 47.7% |
| Sierra Leoneans | 82.9 /100 | #142 | Excellent 47.7% |
| Norwegians | 81.0 /100 | #143 | Excellent 47.6% |
| Slavs | 80.5 /100 | #144 | Excellent 47.6% |
| Canadians | 79.0 /100 | #145 | Good 47.5% |
| Immigrants | Sudan | 77.9 /100 | #146 | Good 47.4% |
| Danes | 77.3 /100 | #147 | Good 47.4% |