Jordanian vs Immigrants from Southern Europe Associate's Degree
COMPARE
Jordanian
Immigrants from Southern Europe
Associate's Degree
Associate's Degree Comparison
Jordanians
Immigrants from Southern Europe
49.2%
ASSOCIATE'S DEGREE
96.6/ 100
METRIC RATING
108th/ 347
METRIC RANK
47.8%
ASSOCIATE'S DEGREE
84.4/ 100
METRIC RATING
140th/ 347
METRIC RANK
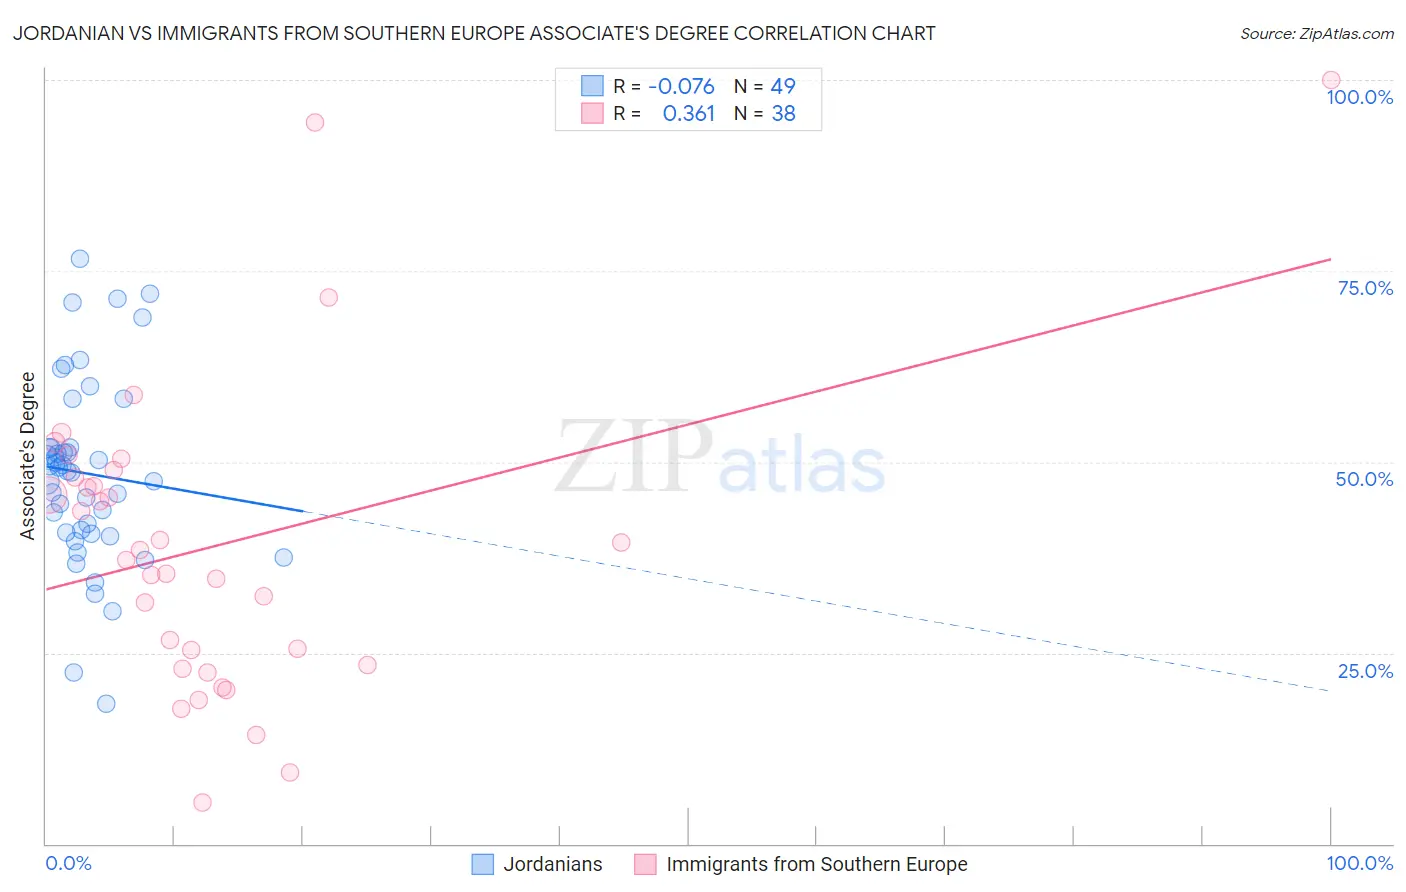
Jordanian vs Immigrants from Southern Europe Associate's Degree Correlation Chart
The statistical analysis conducted on geographies consisting of 166,424,117 people shows a slight negative correlation between the proportion of Jordanians and percentage of population with at least associate's degree education in the United States with a correlation coefficient (R) of -0.076 and weighted average of 49.2%. Similarly, the statistical analysis conducted on geographies consisting of 402,795,863 people shows a mild positive correlation between the proportion of Immigrants from Southern Europe and percentage of population with at least associate's degree education in the United States with a correlation coefficient (R) of 0.361 and weighted average of 47.8%, a difference of 3.0%.
Associate's Degree Correlation Summary
| Measurement | Jordanian | Immigrants from Southern Europe |
| Minimum | 18.4% | 5.4% |
| Maximum | 76.6% | 100.0% |
| Range | 58.2% | 94.6% |
| Mean | 48.5% | 38.9% |
| Median | 48.8% | 37.8% |
| Interquartile 25% (IQ1) | 40.7% | 23.3% |
| Interquartile 75% (IQ3) | 51.9% | 48.0% |
| Interquartile Range (IQR) | 11.1% | 24.7% |
| Standard Deviation (Sample) | 12.2% | 20.1% |
| Standard Deviation (Population) | 12.0% | 19.9% |
Similar Demographics by Associate's Degree
Demographics Similar to Jordanians by Associate's Degree
In terms of associate's degree, the demographic groups most similar to Jordanians are Syrian (49.3%, a difference of 0.060%), Immigrants from Italy (49.3%, a difference of 0.090%), Croatian (49.3%, a difference of 0.10%), Immigrants from Morocco (49.2%, a difference of 0.13%), and Venezuelan (49.4%, a difference of 0.24%).
| Demographics | Rating | Rank | Associate's Degree |
| Northern Europeans | 97.3 /100 | #101 | Exceptional 49.5% |
| Chileans | 97.3 /100 | #102 | Exceptional 49.4% |
| Ukrainians | 97.1 /100 | #103 | Exceptional 49.4% |
| Venezuelans | 97.0 /100 | #104 | Exceptional 49.4% |
| Croatians | 96.8 /100 | #105 | Exceptional 49.3% |
| Immigrants | Italy | 96.7 /100 | #106 | Exceptional 49.3% |
| Syrians | 96.7 /100 | #107 | Exceptional 49.3% |
| Jordanians | 96.6 /100 | #108 | Exceptional 49.2% |
| Immigrants | Morocco | 96.3 /100 | #109 | Exceptional 49.2% |
| Austrians | 95.8 /100 | #110 | Exceptional 49.1% |
| Immigrants | Venezuela | 95.8 /100 | #111 | Exceptional 49.1% |
| Immigrants | Chile | 95.3 /100 | #112 | Exceptional 49.0% |
| Palestinians | 95.3 /100 | #113 | Exceptional 49.0% |
| Arabs | 95.3 /100 | #114 | Exceptional 49.0% |
| Luxembourgers | 95.1 /100 | #115 | Exceptional 48.9% |
Demographics Similar to Immigrants from Southern Europe by Associate's Degree
In terms of associate's degree, the demographic groups most similar to Immigrants from Southern Europe are Slovene (47.9%, a difference of 0.090%), Taiwanese (47.7%, a difference of 0.15%), Sierra Leonean (47.7%, a difference of 0.20%), Norwegian (47.6%, a difference of 0.43%), and Polish (48.0%, a difference of 0.44%).
| Demographics | Rating | Rank | Associate's Degree |
| Assyrians/Chaldeans/Syriacs | 89.4 /100 | #133 | Excellent 48.2% |
| Moroccans | 89.3 /100 | #134 | Excellent 48.2% |
| Europeans | 89.0 /100 | #135 | Excellent 48.2% |
| Pakistanis | 88.0 /100 | #136 | Excellent 48.1% |
| Immigrants | Eritrea | 87.8 /100 | #137 | Excellent 48.1% |
| Poles | 87.3 /100 | #138 | Excellent 48.0% |
| Slovenes | 85.1 /100 | #139 | Excellent 47.9% |
| Immigrants | Southern Europe | 84.4 /100 | #140 | Excellent 47.8% |
| Taiwanese | 83.3 /100 | #141 | Excellent 47.7% |
| Sierra Leoneans | 82.9 /100 | #142 | Excellent 47.7% |
| Norwegians | 81.0 /100 | #143 | Excellent 47.6% |
| Slavs | 80.5 /100 | #144 | Excellent 47.6% |
| Canadians | 79.0 /100 | #145 | Good 47.5% |
| Immigrants | Sudan | 77.9 /100 | #146 | Good 47.4% |
| Danes | 77.3 /100 | #147 | Good 47.4% |