U.S. Virgin Islander vs Pima Associate's Degree
COMPARE
U.S. Virgin Islander
Pima
Associate's Degree
Associate's Degree Comparison
U.S. Virgin Islanders
Pima
42.1%
ASSOCIATE'S DEGREE
0.7/ 100
METRIC RATING
250th/ 347
METRIC RANK
30.2%
ASSOCIATE'S DEGREE
0.0/ 100
METRIC RATING
345th/ 347
METRIC RANK
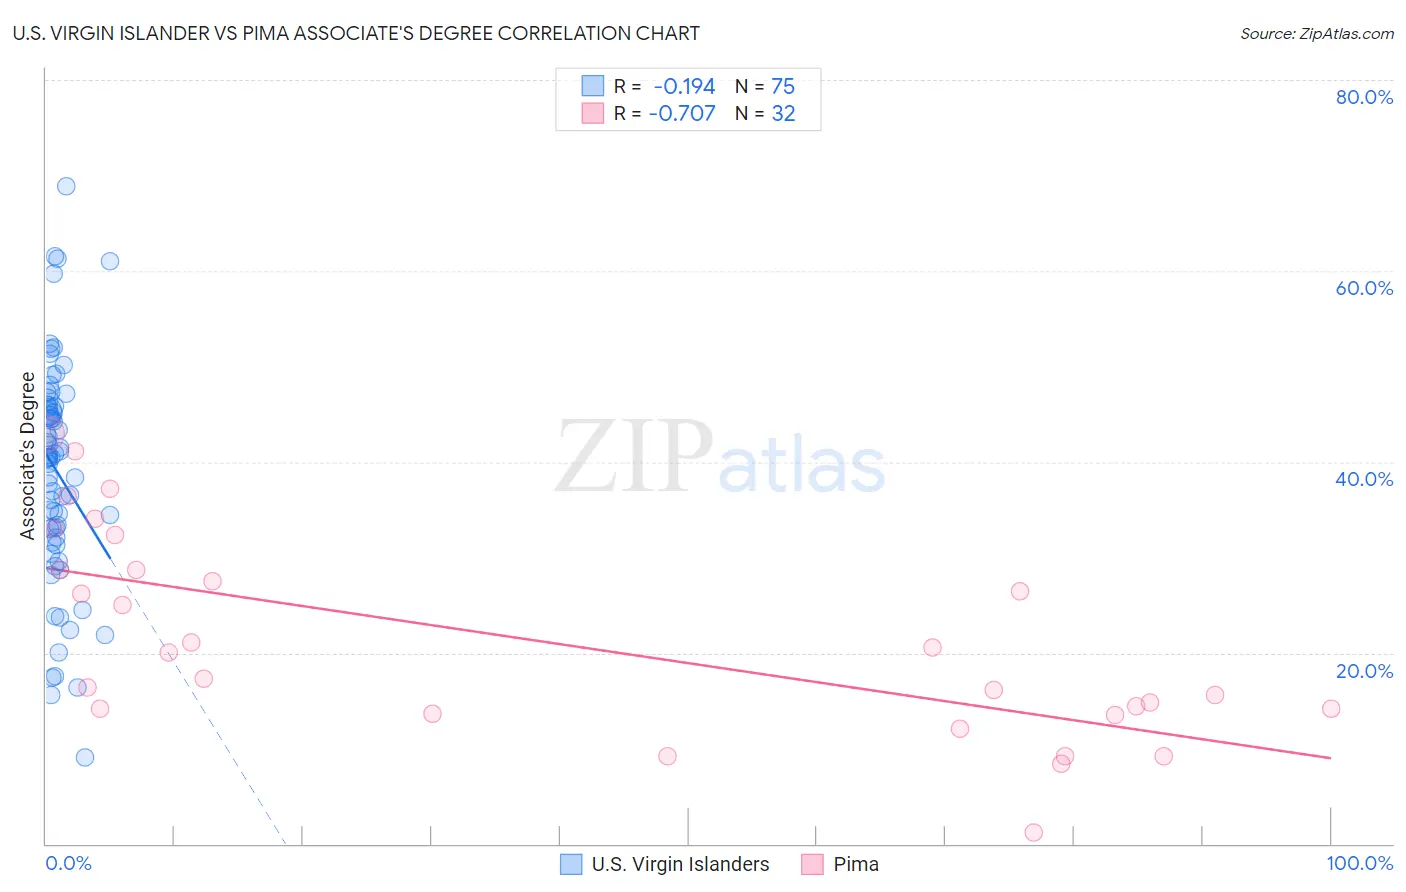
U.S. Virgin Islander vs Pima Associate's Degree Correlation Chart
The statistical analysis conducted on geographies consisting of 87,527,119 people shows a poor negative correlation between the proportion of U.S. Virgin Islanders and percentage of population with at least associate's degree education in the United States with a correlation coefficient (R) of -0.194 and weighted average of 42.1%. Similarly, the statistical analysis conducted on geographies consisting of 61,552,411 people shows a strong negative correlation between the proportion of Pima and percentage of population with at least associate's degree education in the United States with a correlation coefficient (R) of -0.707 and weighted average of 30.2%, a difference of 39.3%.
Associate's Degree Correlation Summary
| Measurement | U.S. Virgin Islander | Pima |
| Minimum | 9.0% | 1.2% |
| Maximum | 68.9% | 42.9% |
| Range | 59.9% | 41.8% |
| Mean | 38.9% | 21.3% |
| Median | 40.4% | 18.6% |
| Interquartile 25% (IQ1) | 32.1% | 13.8% |
| Interquartile 75% (IQ3) | 45.9% | 28.6% |
| Interquartile Range (IQR) | 13.8% | 14.8% |
| Standard Deviation (Sample) | 11.6% | 10.6% |
| Standard Deviation (Population) | 11.5% | 10.4% |
Similar Demographics by Associate's Degree
Demographics Similar to U.S. Virgin Islanders by Associate's Degree
In terms of associate's degree, the demographic groups most similar to U.S. Virgin Islanders are Jamaican (42.1%, a difference of 0.010%), Immigrants from Bahamas (42.1%, a difference of 0.020%), Immigrants from Ecuador (42.2%, a difference of 0.16%), Immigrants from Fiji (42.2%, a difference of 0.24%), and Delaware (42.3%, a difference of 0.33%).
| Demographics | Rating | Rank | Associate's Degree |
| Guyanese | 1.0 /100 | #243 | Tragic 42.3% |
| Immigrants | Liberia | 0.9 /100 | #244 | Tragic 42.3% |
| Immigrants | Cambodia | 0.9 /100 | #245 | Tragic 42.3% |
| Delaware | 0.9 /100 | #246 | Tragic 42.3% |
| Immigrants | Fiji | 0.8 /100 | #247 | Tragic 42.2% |
| Immigrants | Ecuador | 0.8 /100 | #248 | Tragic 42.2% |
| Jamaicans | 0.7 /100 | #249 | Tragic 42.1% |
| U.S. Virgin Islanders | 0.7 /100 | #250 | Tragic 42.1% |
| Immigrants | Bahamas | 0.7 /100 | #251 | Tragic 42.1% |
| French American Indians | 0.6 /100 | #252 | Tragic 42.0% |
| Indonesians | 0.6 /100 | #253 | Tragic 41.9% |
| Cubans | 0.6 /100 | #254 | Tragic 41.9% |
| Immigrants | Guyana | 0.5 /100 | #255 | Tragic 41.8% |
| Immigrants | Congo | 0.5 /100 | #256 | Tragic 41.8% |
| Spanish Americans | 0.5 /100 | #257 | Tragic 41.8% |
Demographics Similar to Pima by Associate's Degree
In terms of associate's degree, the demographic groups most similar to Pima are Yuman (31.3%, a difference of 3.4%), Tohono O'odham (31.8%, a difference of 5.1%), Yakama (32.3%, a difference of 6.9%), Houma (28.2%, a difference of 7.2%), and Inupiat (32.6%, a difference of 7.7%).
| Demographics | Rating | Rank | Associate's Degree |
| Mexicans | 0.0 /100 | #333 | Tragic 35.0% |
| Natives/Alaskans | 0.0 /100 | #334 | Tragic 34.9% |
| Spanish American Indians | 0.0 /100 | #335 | Tragic 34.9% |
| Hopi | 0.0 /100 | #336 | Tragic 34.6% |
| Lumbee | 0.0 /100 | #337 | Tragic 34.1% |
| Pueblo | 0.0 /100 | #338 | Tragic 34.0% |
| Immigrants | Mexico | 0.0 /100 | #339 | Tragic 33.7% |
| Navajo | 0.0 /100 | #340 | Tragic 32.6% |
| Inupiat | 0.0 /100 | #341 | Tragic 32.6% |
| Yakama | 0.0 /100 | #342 | Tragic 32.3% |
| Tohono O'odham | 0.0 /100 | #343 | Tragic 31.8% |
| Yuman | 0.0 /100 | #344 | Tragic 31.3% |
| Pima | 0.0 /100 | #345 | Tragic 30.2% |
| Houma | 0.0 /100 | #346 | Tragic 28.2% |
| Yup'ik | 0.0 /100 | #347 | Tragic 25.0% |