U.S. Virgin Islander vs Creek Associate's Degree
COMPARE
U.S. Virgin Islander
Creek
Associate's Degree
Associate's Degree Comparison
U.S. Virgin Islanders
Creek
42.1%
ASSOCIATE'S DEGREE
0.7/ 100
METRIC RATING
250th/ 347
METRIC RANK
37.6%
ASSOCIATE'S DEGREE
0.0/ 100
METRIC RATING
315th/ 347
METRIC RANK
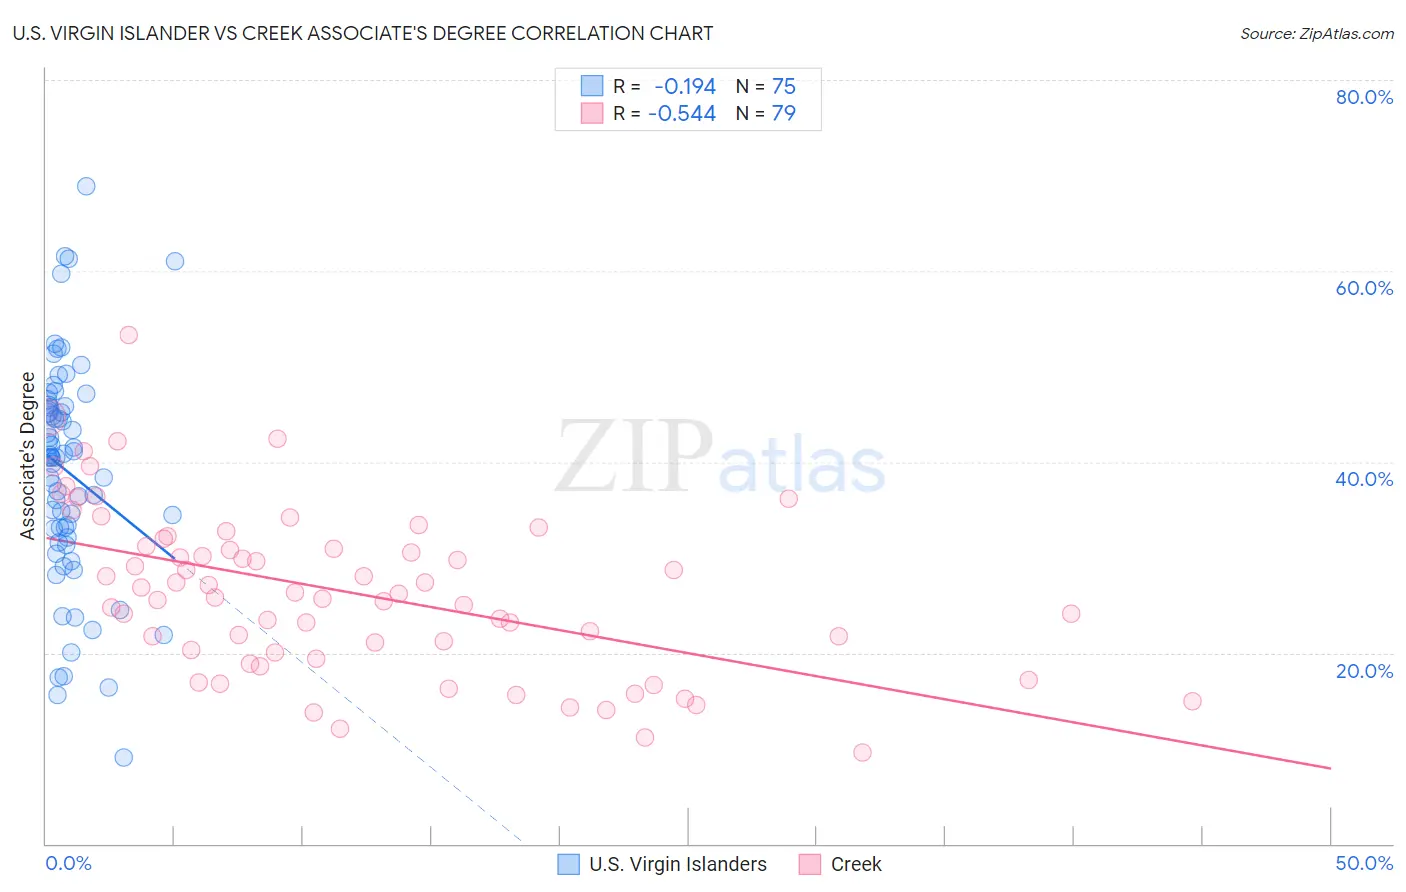
U.S. Virgin Islander vs Creek Associate's Degree Correlation Chart
The statistical analysis conducted on geographies consisting of 87,527,119 people shows a poor negative correlation between the proportion of U.S. Virgin Islanders and percentage of population with at least associate's degree education in the United States with a correlation coefficient (R) of -0.194 and weighted average of 42.1%. Similarly, the statistical analysis conducted on geographies consisting of 178,480,454 people shows a substantial negative correlation between the proportion of Creek and percentage of population with at least associate's degree education in the United States with a correlation coefficient (R) of -0.544 and weighted average of 37.6%, a difference of 12.1%.
Associate's Degree Correlation Summary
| Measurement | U.S. Virgin Islander | Creek |
| Minimum | 9.0% | 9.5% |
| Maximum | 68.9% | 53.2% |
| Range | 59.9% | 43.7% |
| Mean | 38.9% | 26.4% |
| Median | 40.4% | 26.2% |
| Interquartile 25% (IQ1) | 32.1% | 20.0% |
| Interquartile 75% (IQ3) | 45.9% | 31.9% |
| Interquartile Range (IQR) | 13.8% | 11.9% |
| Standard Deviation (Sample) | 11.6% | 8.7% |
| Standard Deviation (Population) | 11.5% | 8.7% |
Similar Demographics by Associate's Degree
Demographics Similar to U.S. Virgin Islanders by Associate's Degree
In terms of associate's degree, the demographic groups most similar to U.S. Virgin Islanders are Jamaican (42.1%, a difference of 0.010%), Immigrants from Bahamas (42.1%, a difference of 0.020%), Immigrants from Ecuador (42.2%, a difference of 0.16%), Immigrants from Fiji (42.2%, a difference of 0.24%), and Delaware (42.3%, a difference of 0.33%).
| Demographics | Rating | Rank | Associate's Degree |
| Guyanese | 1.0 /100 | #243 | Tragic 42.3% |
| Immigrants | Liberia | 0.9 /100 | #244 | Tragic 42.3% |
| Immigrants | Cambodia | 0.9 /100 | #245 | Tragic 42.3% |
| Delaware | 0.9 /100 | #246 | Tragic 42.3% |
| Immigrants | Fiji | 0.8 /100 | #247 | Tragic 42.2% |
| Immigrants | Ecuador | 0.8 /100 | #248 | Tragic 42.2% |
| Jamaicans | 0.7 /100 | #249 | Tragic 42.1% |
| U.S. Virgin Islanders | 0.7 /100 | #250 | Tragic 42.1% |
| Immigrants | Bahamas | 0.7 /100 | #251 | Tragic 42.1% |
| French American Indians | 0.6 /100 | #252 | Tragic 42.0% |
| Indonesians | 0.6 /100 | #253 | Tragic 41.9% |
| Cubans | 0.6 /100 | #254 | Tragic 41.9% |
| Immigrants | Guyana | 0.5 /100 | #255 | Tragic 41.8% |
| Immigrants | Congo | 0.5 /100 | #256 | Tragic 41.8% |
| Spanish Americans | 0.5 /100 | #257 | Tragic 41.8% |
Demographics Similar to Creek by Associate's Degree
In terms of associate's degree, the demographic groups most similar to Creek are Crow (37.6%, a difference of 0.010%), Yaqui (37.6%, a difference of 0.020%), Alaska Native (37.5%, a difference of 0.26%), Seminole (37.7%, a difference of 0.39%), and Hispanic or Latino (37.7%, a difference of 0.44%).
| Demographics | Rating | Rank | Associate's Degree |
| Mexican American Indians | 0.0 /100 | #308 | Tragic 38.2% |
| Immigrants | Guatemala | 0.0 /100 | #309 | Tragic 38.1% |
| Immigrants | Dominican Republic | 0.0 /100 | #310 | Tragic 37.9% |
| Immigrants | Latin America | 0.0 /100 | #311 | Tragic 37.9% |
| Choctaw | 0.0 /100 | #312 | Tragic 37.8% |
| Hispanics or Latinos | 0.0 /100 | #313 | Tragic 37.7% |
| Seminole | 0.0 /100 | #314 | Tragic 37.7% |
| Creek | 0.0 /100 | #315 | Tragic 37.6% |
| Crow | 0.0 /100 | #316 | Tragic 37.6% |
| Yaqui | 0.0 /100 | #317 | Tragic 37.6% |
| Alaska Natives | 0.0 /100 | #318 | Tragic 37.5% |
| Fijians | 0.0 /100 | #319 | Tragic 37.4% |
| Cajuns | 0.0 /100 | #320 | Tragic 37.4% |
| Immigrants | Yemen | 0.0 /100 | #321 | Tragic 37.3% |
| Pennsylvania Germans | 0.0 /100 | #322 | Tragic 37.2% |