Hawaiian vs Immigrants from Southern Europe Associate's Degree
COMPARE
Hawaiian
Immigrants from Southern Europe
Associate's Degree
Associate's Degree Comparison
Hawaiians
Immigrants from Southern Europe
40.9%
ASSOCIATE'S DEGREE
0.2/ 100
METRIC RATING
267th/ 347
METRIC RANK
47.8%
ASSOCIATE'S DEGREE
84.4/ 100
METRIC RATING
140th/ 347
METRIC RANK
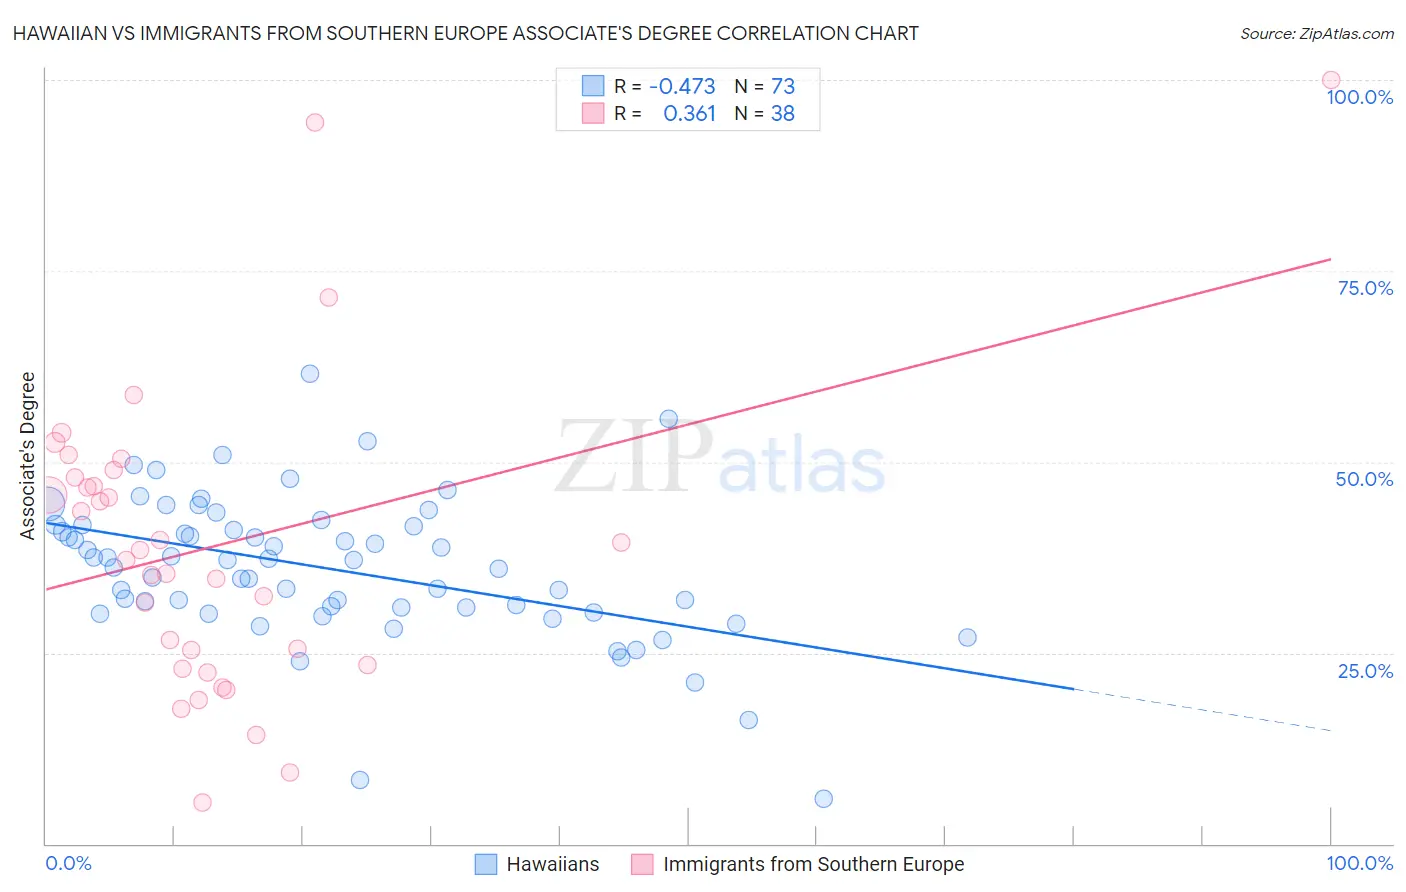
Hawaiian vs Immigrants from Southern Europe Associate's Degree Correlation Chart
The statistical analysis conducted on geographies consisting of 327,594,754 people shows a moderate negative correlation between the proportion of Hawaiians and percentage of population with at least associate's degree education in the United States with a correlation coefficient (R) of -0.473 and weighted average of 40.9%. Similarly, the statistical analysis conducted on geographies consisting of 402,795,863 people shows a mild positive correlation between the proportion of Immigrants from Southern Europe and percentage of population with at least associate's degree education in the United States with a correlation coefficient (R) of 0.361 and weighted average of 47.8%, a difference of 16.9%.
Associate's Degree Correlation Summary
| Measurement | Hawaiian | Immigrants from Southern Europe |
| Minimum | 5.9% | 5.4% |
| Maximum | 61.5% | 100.0% |
| Range | 55.7% | 94.6% |
| Mean | 36.0% | 38.9% |
| Median | 37.2% | 37.8% |
| Interquartile 25% (IQ1) | 30.6% | 23.3% |
| Interquartile 75% (IQ3) | 41.7% | 48.0% |
| Interquartile Range (IQR) | 11.0% | 24.7% |
| Standard Deviation (Sample) | 9.5% | 20.1% |
| Standard Deviation (Population) | 9.4% | 19.9% |
Similar Demographics by Associate's Degree
Demographics Similar to Hawaiians by Associate's Degree
In terms of associate's degree, the demographic groups most similar to Hawaiians are Central American Indian (40.8%, a difference of 0.20%), American (40.8%, a difference of 0.38%), Chippewa (40.7%, a difference of 0.42%), African (41.1%, a difference of 0.56%), and Samoan (41.1%, a difference of 0.56%).
| Demographics | Rating | Rank | Associate's Degree |
| Marshallese | 0.4 /100 | #260 | Tragic 41.6% |
| Nicaraguans | 0.4 /100 | #261 | Tragic 41.5% |
| Bahamians | 0.4 /100 | #262 | Tragic 41.5% |
| Immigrants | Jamaica | 0.3 /100 | #263 | Tragic 41.5% |
| Osage | 0.3 /100 | #264 | Tragic 41.5% |
| Africans | 0.2 /100 | #265 | Tragic 41.1% |
| Samoans | 0.2 /100 | #266 | Tragic 41.1% |
| Hawaiians | 0.2 /100 | #267 | Tragic 40.9% |
| Central American Indians | 0.2 /100 | #268 | Tragic 40.8% |
| Americans | 0.2 /100 | #269 | Tragic 40.8% |
| Chippewa | 0.2 /100 | #270 | Tragic 40.7% |
| Immigrants | Laos | 0.1 /100 | #271 | Tragic 40.7% |
| Belizeans | 0.1 /100 | #272 | Tragic 40.6% |
| Puget Sound Salish | 0.1 /100 | #273 | Tragic 40.5% |
| Immigrants | Dominica | 0.1 /100 | #274 | Tragic 40.5% |
Demographics Similar to Immigrants from Southern Europe by Associate's Degree
In terms of associate's degree, the demographic groups most similar to Immigrants from Southern Europe are Slovene (47.9%, a difference of 0.090%), Taiwanese (47.7%, a difference of 0.15%), Sierra Leonean (47.7%, a difference of 0.20%), Norwegian (47.6%, a difference of 0.43%), and Polish (48.0%, a difference of 0.44%).
| Demographics | Rating | Rank | Associate's Degree |
| Assyrians/Chaldeans/Syriacs | 89.4 /100 | #133 | Excellent 48.2% |
| Moroccans | 89.3 /100 | #134 | Excellent 48.2% |
| Europeans | 89.0 /100 | #135 | Excellent 48.2% |
| Pakistanis | 88.0 /100 | #136 | Excellent 48.1% |
| Immigrants | Eritrea | 87.8 /100 | #137 | Excellent 48.1% |
| Poles | 87.3 /100 | #138 | Excellent 48.0% |
| Slovenes | 85.1 /100 | #139 | Excellent 47.9% |
| Immigrants | Southern Europe | 84.4 /100 | #140 | Excellent 47.8% |
| Taiwanese | 83.3 /100 | #141 | Excellent 47.7% |
| Sierra Leoneans | 82.9 /100 | #142 | Excellent 47.7% |
| Norwegians | 81.0 /100 | #143 | Excellent 47.6% |
| Slavs | 80.5 /100 | #144 | Excellent 47.6% |
| Canadians | 79.0 /100 | #145 | Good 47.5% |
| Immigrants | Sudan | 77.9 /100 | #146 | Good 47.4% |
| Danes | 77.3 /100 | #147 | Good 47.4% |