U.S. Virgin Islander vs Sioux Associate's Degree
COMPARE
U.S. Virgin Islander
Sioux
Associate's Degree
Associate's Degree Comparison
U.S. Virgin Islanders
Sioux
42.1%
ASSOCIATE'S DEGREE
0.7/ 100
METRIC RATING
250th/ 347
METRIC RANK
38.5%
ASSOCIATE'S DEGREE
0.0/ 100
METRIC RATING
304th/ 347
METRIC RANK
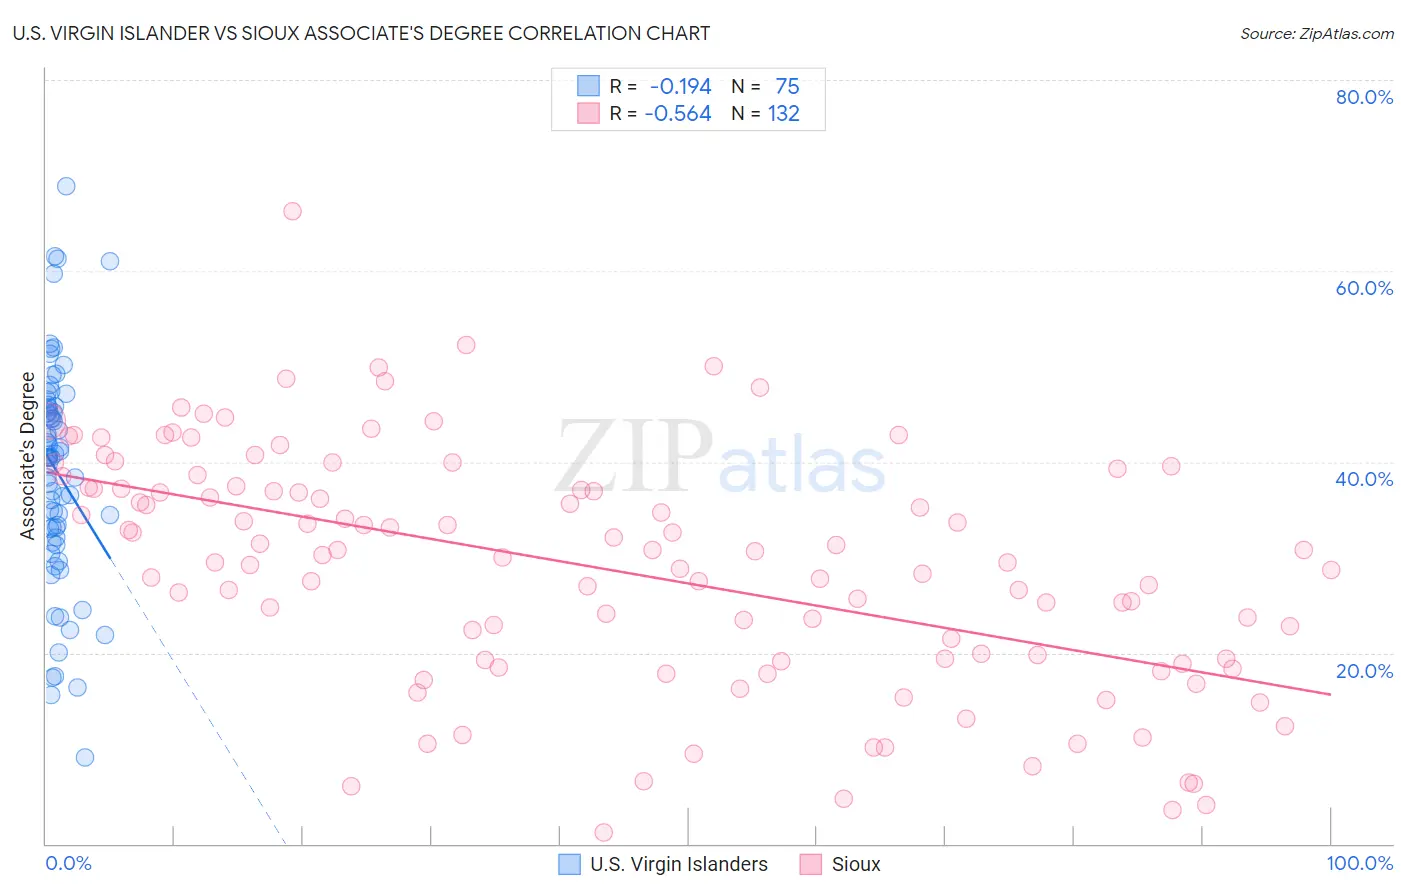
U.S. Virgin Islander vs Sioux Associate's Degree Correlation Chart
The statistical analysis conducted on geographies consisting of 87,527,119 people shows a poor negative correlation between the proportion of U.S. Virgin Islanders and percentage of population with at least associate's degree education in the United States with a correlation coefficient (R) of -0.194 and weighted average of 42.1%. Similarly, the statistical analysis conducted on geographies consisting of 234,195,358 people shows a substantial negative correlation between the proportion of Sioux and percentage of population with at least associate's degree education in the United States with a correlation coefficient (R) of -0.564 and weighted average of 38.5%, a difference of 9.5%.
Associate's Degree Correlation Summary
| Measurement | U.S. Virgin Islander | Sioux |
| Minimum | 9.0% | 1.2% |
| Maximum | 68.9% | 66.3% |
| Range | 59.9% | 65.1% |
| Mean | 38.9% | 28.9% |
| Median | 40.4% | 30.1% |
| Interquartile 25% (IQ1) | 32.1% | 19.3% |
| Interquartile 75% (IQ3) | 45.9% | 37.3% |
| Interquartile Range (IQR) | 13.8% | 18.0% |
| Standard Deviation (Sample) | 11.6% | 12.4% |
| Standard Deviation (Population) | 11.5% | 12.3% |
Similar Demographics by Associate's Degree
Demographics Similar to U.S. Virgin Islanders by Associate's Degree
In terms of associate's degree, the demographic groups most similar to U.S. Virgin Islanders are Jamaican (42.1%, a difference of 0.010%), Immigrants from Bahamas (42.1%, a difference of 0.020%), Immigrants from Ecuador (42.2%, a difference of 0.16%), Immigrants from Fiji (42.2%, a difference of 0.24%), and Delaware (42.3%, a difference of 0.33%).
| Demographics | Rating | Rank | Associate's Degree |
| Guyanese | 1.0 /100 | #243 | Tragic 42.3% |
| Immigrants | Liberia | 0.9 /100 | #244 | Tragic 42.3% |
| Immigrants | Cambodia | 0.9 /100 | #245 | Tragic 42.3% |
| Delaware | 0.9 /100 | #246 | Tragic 42.3% |
| Immigrants | Fiji | 0.8 /100 | #247 | Tragic 42.2% |
| Immigrants | Ecuador | 0.8 /100 | #248 | Tragic 42.2% |
| Jamaicans | 0.7 /100 | #249 | Tragic 42.1% |
| U.S. Virgin Islanders | 0.7 /100 | #250 | Tragic 42.1% |
| Immigrants | Bahamas | 0.7 /100 | #251 | Tragic 42.1% |
| French American Indians | 0.6 /100 | #252 | Tragic 42.0% |
| Indonesians | 0.6 /100 | #253 | Tragic 41.9% |
| Cubans | 0.6 /100 | #254 | Tragic 41.9% |
| Immigrants | Guyana | 0.5 /100 | #255 | Tragic 41.8% |
| Immigrants | Congo | 0.5 /100 | #256 | Tragic 41.8% |
| Spanish Americans | 0.5 /100 | #257 | Tragic 41.8% |
Demographics Similar to Sioux by Associate's Degree
In terms of associate's degree, the demographic groups most similar to Sioux are Guatemalan (38.5%, a difference of 0.050%), Immigrants from Honduras (38.5%, a difference of 0.070%), Shoshone (38.4%, a difference of 0.13%), Colville (38.5%, a difference of 0.14%), and Immigrants from El Salvador (38.4%, a difference of 0.17%).
| Demographics | Rating | Rank | Associate's Degree |
| Cape Verdeans | 0.0 /100 | #297 | Tragic 38.8% |
| Cheyenne | 0.0 /100 | #298 | Tragic 38.7% |
| Ute | 0.0 /100 | #299 | Tragic 38.6% |
| Chickasaw | 0.0 /100 | #300 | Tragic 38.6% |
| Tsimshian | 0.0 /100 | #301 | Tragic 38.6% |
| Colville | 0.0 /100 | #302 | Tragic 38.5% |
| Guatemalans | 0.0 /100 | #303 | Tragic 38.5% |
| Sioux | 0.0 /100 | #304 | Tragic 38.5% |
| Immigrants | Honduras | 0.0 /100 | #305 | Tragic 38.5% |
| Shoshone | 0.0 /100 | #306 | Tragic 38.4% |
| Immigrants | El Salvador | 0.0 /100 | #307 | Tragic 38.4% |
| Mexican American Indians | 0.0 /100 | #308 | Tragic 38.2% |
| Immigrants | Guatemala | 0.0 /100 | #309 | Tragic 38.1% |
| Immigrants | Dominican Republic | 0.0 /100 | #310 | Tragic 37.9% |
| Immigrants | Latin America | 0.0 /100 | #311 | Tragic 37.9% |