Salvadoran vs Immigrants from Southern Europe Associate's Degree
COMPARE
Salvadoran
Immigrants from Southern Europe
Associate's Degree
Associate's Degree Comparison
Salvadorans
Immigrants from Southern Europe
39.0%
ASSOCIATE'S DEGREE
0.0/ 100
METRIC RATING
294th/ 347
METRIC RANK
47.8%
ASSOCIATE'S DEGREE
84.4/ 100
METRIC RATING
140th/ 347
METRIC RANK
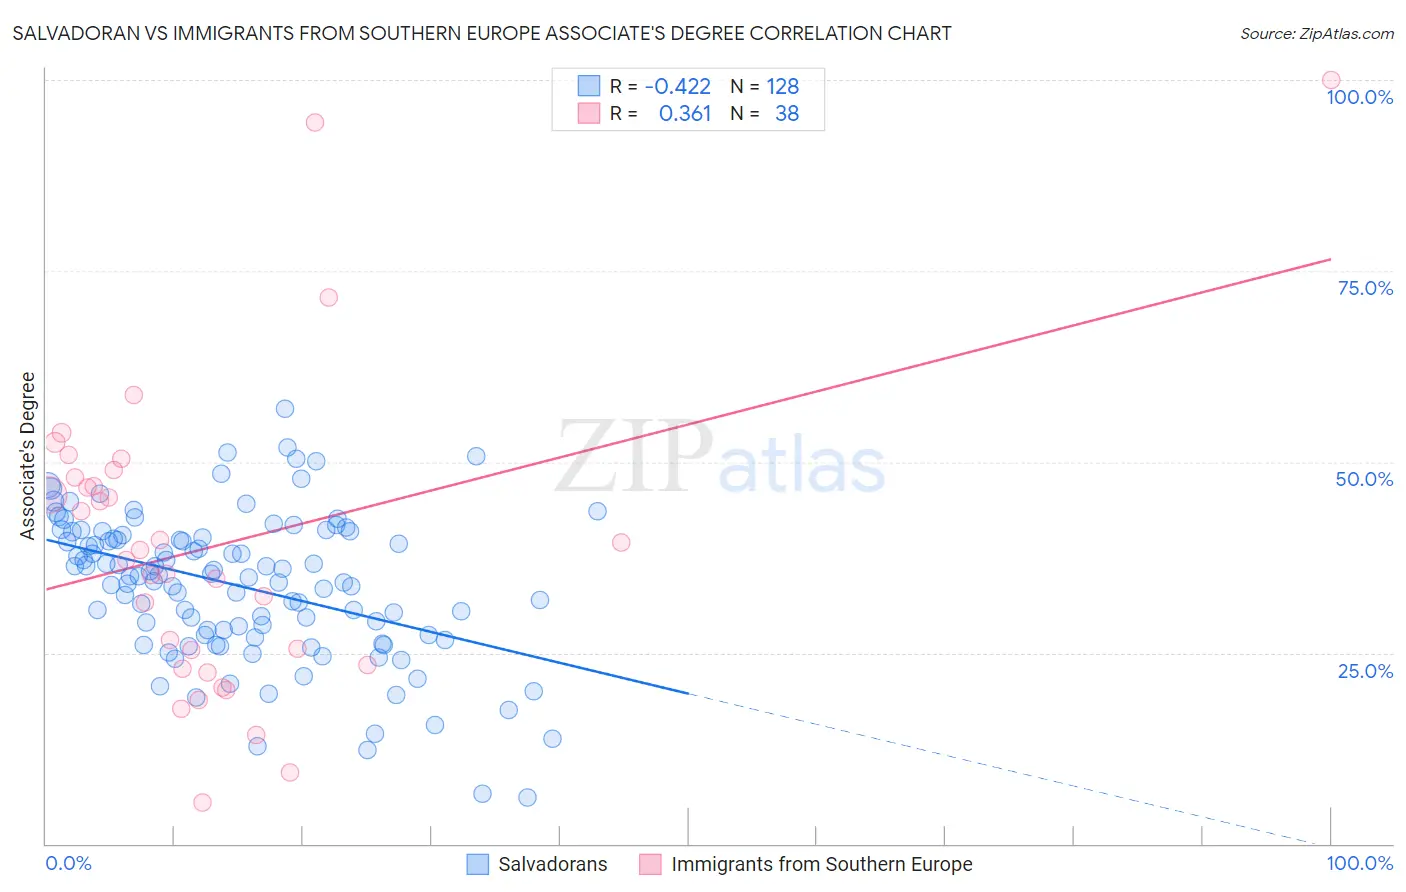
Salvadoran vs Immigrants from Southern Europe Associate's Degree Correlation Chart
The statistical analysis conducted on geographies consisting of 399,027,766 people shows a moderate negative correlation between the proportion of Salvadorans and percentage of population with at least associate's degree education in the United States with a correlation coefficient (R) of -0.422 and weighted average of 39.0%. Similarly, the statistical analysis conducted on geographies consisting of 402,795,863 people shows a mild positive correlation between the proportion of Immigrants from Southern Europe and percentage of population with at least associate's degree education in the United States with a correlation coefficient (R) of 0.361 and weighted average of 47.8%, a difference of 22.5%.
Associate's Degree Correlation Summary
| Measurement | Salvadoran | Immigrants from Southern Europe |
| Minimum | 6.1% | 5.4% |
| Maximum | 57.0% | 100.0% |
| Range | 50.9% | 94.6% |
| Mean | 33.7% | 38.9% |
| Median | 35.0% | 37.8% |
| Interquartile 25% (IQ1) | 27.3% | 23.3% |
| Interquartile 75% (IQ3) | 40.3% | 48.0% |
| Interquartile Range (IQR) | 12.9% | 24.7% |
| Standard Deviation (Sample) | 9.6% | 20.1% |
| Standard Deviation (Population) | 9.5% | 19.9% |
Similar Demographics by Associate's Degree
Demographics Similar to Salvadorans by Associate's Degree
In terms of associate's degree, the demographic groups most similar to Salvadorans are Nepalese (39.0%, a difference of 0.0%), Black/African American (39.1%, a difference of 0.25%), Honduran (38.9%, a difference of 0.29%), Cherokee (38.9%, a difference of 0.46%), and Dominican (39.3%, a difference of 0.54%).
| Demographics | Rating | Rank | Associate's Degree |
| Aleuts | 0.0 /100 | #287 | Tragic 39.6% |
| Immigrants | Cuba | 0.0 /100 | #288 | Tragic 39.5% |
| Central Americans | 0.0 /100 | #289 | Tragic 39.4% |
| Immigrants | Haiti | 0.0 /100 | #290 | Tragic 39.3% |
| Dominicans | 0.0 /100 | #291 | Tragic 39.3% |
| Blacks/African Americans | 0.0 /100 | #292 | Tragic 39.1% |
| Nepalese | 0.0 /100 | #293 | Tragic 39.0% |
| Salvadorans | 0.0 /100 | #294 | Tragic 39.0% |
| Hondurans | 0.0 /100 | #295 | Tragic 38.9% |
| Cherokee | 0.0 /100 | #296 | Tragic 38.9% |
| Cape Verdeans | 0.0 /100 | #297 | Tragic 38.8% |
| Cheyenne | 0.0 /100 | #298 | Tragic 38.7% |
| Ute | 0.0 /100 | #299 | Tragic 38.6% |
| Chickasaw | 0.0 /100 | #300 | Tragic 38.6% |
| Tsimshian | 0.0 /100 | #301 | Tragic 38.6% |
Demographics Similar to Immigrants from Southern Europe by Associate's Degree
In terms of associate's degree, the demographic groups most similar to Immigrants from Southern Europe are Slovene (47.9%, a difference of 0.090%), Taiwanese (47.7%, a difference of 0.15%), Sierra Leonean (47.7%, a difference of 0.20%), Norwegian (47.6%, a difference of 0.43%), and Polish (48.0%, a difference of 0.44%).
| Demographics | Rating | Rank | Associate's Degree |
| Assyrians/Chaldeans/Syriacs | 89.4 /100 | #133 | Excellent 48.2% |
| Moroccans | 89.3 /100 | #134 | Excellent 48.2% |
| Europeans | 89.0 /100 | #135 | Excellent 48.2% |
| Pakistanis | 88.0 /100 | #136 | Excellent 48.1% |
| Immigrants | Eritrea | 87.8 /100 | #137 | Excellent 48.1% |
| Poles | 87.3 /100 | #138 | Excellent 48.0% |
| Slovenes | 85.1 /100 | #139 | Excellent 47.9% |
| Immigrants | Southern Europe | 84.4 /100 | #140 | Excellent 47.8% |
| Taiwanese | 83.3 /100 | #141 | Excellent 47.7% |
| Sierra Leoneans | 82.9 /100 | #142 | Excellent 47.7% |
| Norwegians | 81.0 /100 | #143 | Excellent 47.6% |
| Slavs | 80.5 /100 | #144 | Excellent 47.6% |
| Canadians | 79.0 /100 | #145 | Good 47.5% |
| Immigrants | Sudan | 77.9 /100 | #146 | Good 47.4% |
| Danes | 77.3 /100 | #147 | Good 47.4% |