Immigrants from Eastern Europe vs Creek Associate's Degree
COMPARE
Immigrants from Eastern Europe
Creek
Associate's Degree
Associate's Degree Comparison
Immigrants from Eastern Europe
Creek
50.5%
ASSOCIATE'S DEGREE
99.1/ 100
METRIC RATING
78th/ 347
METRIC RANK
37.6%
ASSOCIATE'S DEGREE
0.0/ 100
METRIC RATING
315th/ 347
METRIC RANK
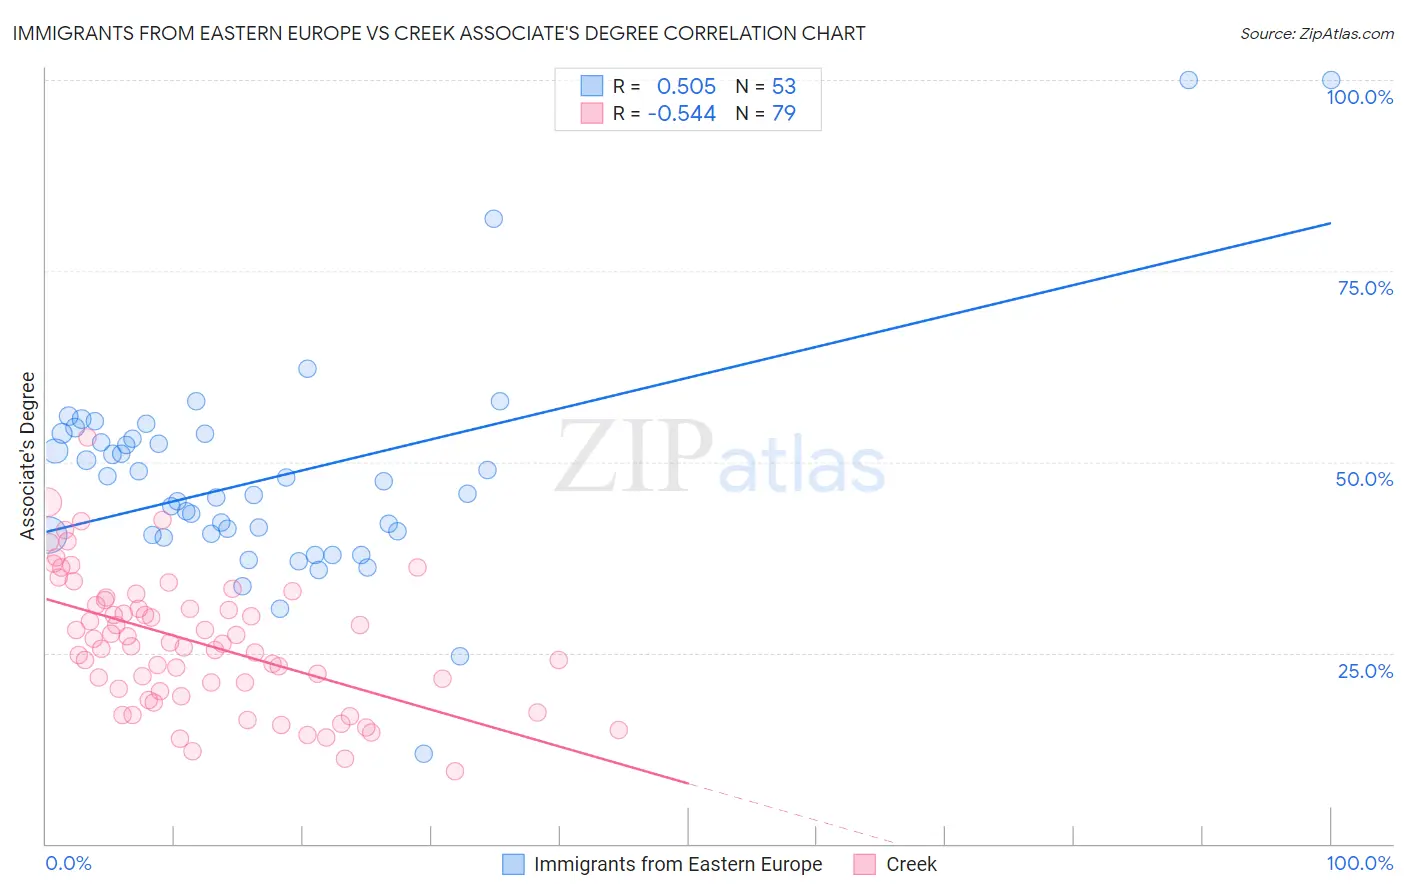
Immigrants from Eastern Europe vs Creek Associate's Degree Correlation Chart
The statistical analysis conducted on geographies consisting of 475,831,649 people shows a substantial positive correlation between the proportion of Immigrants from Eastern Europe and percentage of population with at least associate's degree education in the United States with a correlation coefficient (R) of 0.505 and weighted average of 50.5%. Similarly, the statistical analysis conducted on geographies consisting of 178,480,454 people shows a substantial negative correlation between the proportion of Creek and percentage of population with at least associate's degree education in the United States with a correlation coefficient (R) of -0.544 and weighted average of 37.6%, a difference of 34.3%.
Associate's Degree Correlation Summary
| Measurement | Immigrants from Eastern Europe | Creek |
| Minimum | 11.8% | 9.5% |
| Maximum | 100.0% | 53.2% |
| Range | 88.2% | 43.7% |
| Mean | 47.9% | 26.4% |
| Median | 45.8% | 26.2% |
| Interquartile 25% (IQ1) | 40.4% | 20.0% |
| Interquartile 75% (IQ3) | 53.3% | 31.9% |
| Interquartile Range (IQR) | 12.9% | 11.9% |
| Standard Deviation (Sample) | 14.6% | 8.7% |
| Standard Deviation (Population) | 14.5% | 8.7% |
Similar Demographics by Associate's Degree
Demographics Similar to Immigrants from Eastern Europe by Associate's Degree
In terms of associate's degree, the demographic groups most similar to Immigrants from Eastern Europe are Ethiopian (50.4%, a difference of 0.010%), Immigrants from Lebanon (50.5%, a difference of 0.040%), Armenian (50.4%, a difference of 0.050%), Immigrants from Zimbabwe (50.5%, a difference of 0.080%), and Maltese (50.4%, a difference of 0.12%).
| Demographics | Rating | Rank | Associate's Degree |
| Immigrants | Romania | 99.5 /100 | #71 | Exceptional 50.9% |
| Immigrants | Pakistan | 99.5 /100 | #72 | Exceptional 50.9% |
| Carpatho Rusyns | 99.3 /100 | #73 | Exceptional 50.6% |
| Lithuanians | 99.3 /100 | #74 | Exceptional 50.6% |
| Immigrants | Scotland | 99.3 /100 | #75 | Exceptional 50.6% |
| Immigrants | Zimbabwe | 99.2 /100 | #76 | Exceptional 50.5% |
| Immigrants | Lebanon | 99.1 /100 | #77 | Exceptional 50.5% |
| Immigrants | Eastern Europe | 99.1 /100 | #78 | Exceptional 50.5% |
| Ethiopians | 99.1 /100 | #79 | Exceptional 50.4% |
| Armenians | 99.1 /100 | #80 | Exceptional 50.4% |
| Maltese | 99.1 /100 | #81 | Exceptional 50.4% |
| Greeks | 98.9 /100 | #82 | Exceptional 50.3% |
| Immigrants | Uzbekistan | 98.9 /100 | #83 | Exceptional 50.3% |
| Immigrants | Hungary | 98.9 /100 | #84 | Exceptional 50.2% |
| Immigrants | Egypt | 98.9 /100 | #85 | Exceptional 50.2% |
Demographics Similar to Creek by Associate's Degree
In terms of associate's degree, the demographic groups most similar to Creek are Crow (37.6%, a difference of 0.010%), Yaqui (37.6%, a difference of 0.020%), Alaska Native (37.5%, a difference of 0.26%), Seminole (37.7%, a difference of 0.39%), and Hispanic or Latino (37.7%, a difference of 0.44%).
| Demographics | Rating | Rank | Associate's Degree |
| Mexican American Indians | 0.0 /100 | #308 | Tragic 38.2% |
| Immigrants | Guatemala | 0.0 /100 | #309 | Tragic 38.1% |
| Immigrants | Dominican Republic | 0.0 /100 | #310 | Tragic 37.9% |
| Immigrants | Latin America | 0.0 /100 | #311 | Tragic 37.9% |
| Choctaw | 0.0 /100 | #312 | Tragic 37.8% |
| Hispanics or Latinos | 0.0 /100 | #313 | Tragic 37.7% |
| Seminole | 0.0 /100 | #314 | Tragic 37.7% |
| Creek | 0.0 /100 | #315 | Tragic 37.6% |
| Crow | 0.0 /100 | #316 | Tragic 37.6% |
| Yaqui | 0.0 /100 | #317 | Tragic 37.6% |
| Alaska Natives | 0.0 /100 | #318 | Tragic 37.5% |
| Fijians | 0.0 /100 | #319 | Tragic 37.4% |
| Cajuns | 0.0 /100 | #320 | Tragic 37.4% |
| Immigrants | Yemen | 0.0 /100 | #321 | Tragic 37.3% |
| Pennsylvania Germans | 0.0 /100 | #322 | Tragic 37.2% |