Cuban vs Creek Associate's Degree
COMPARE
Cuban
Creek
Associate's Degree
Associate's Degree Comparison
Cubans
Creek
41.9%
ASSOCIATE'S DEGREE
0.6/ 100
METRIC RATING
254th/ 347
METRIC RANK
37.6%
ASSOCIATE'S DEGREE
0.0/ 100
METRIC RATING
315th/ 347
METRIC RANK
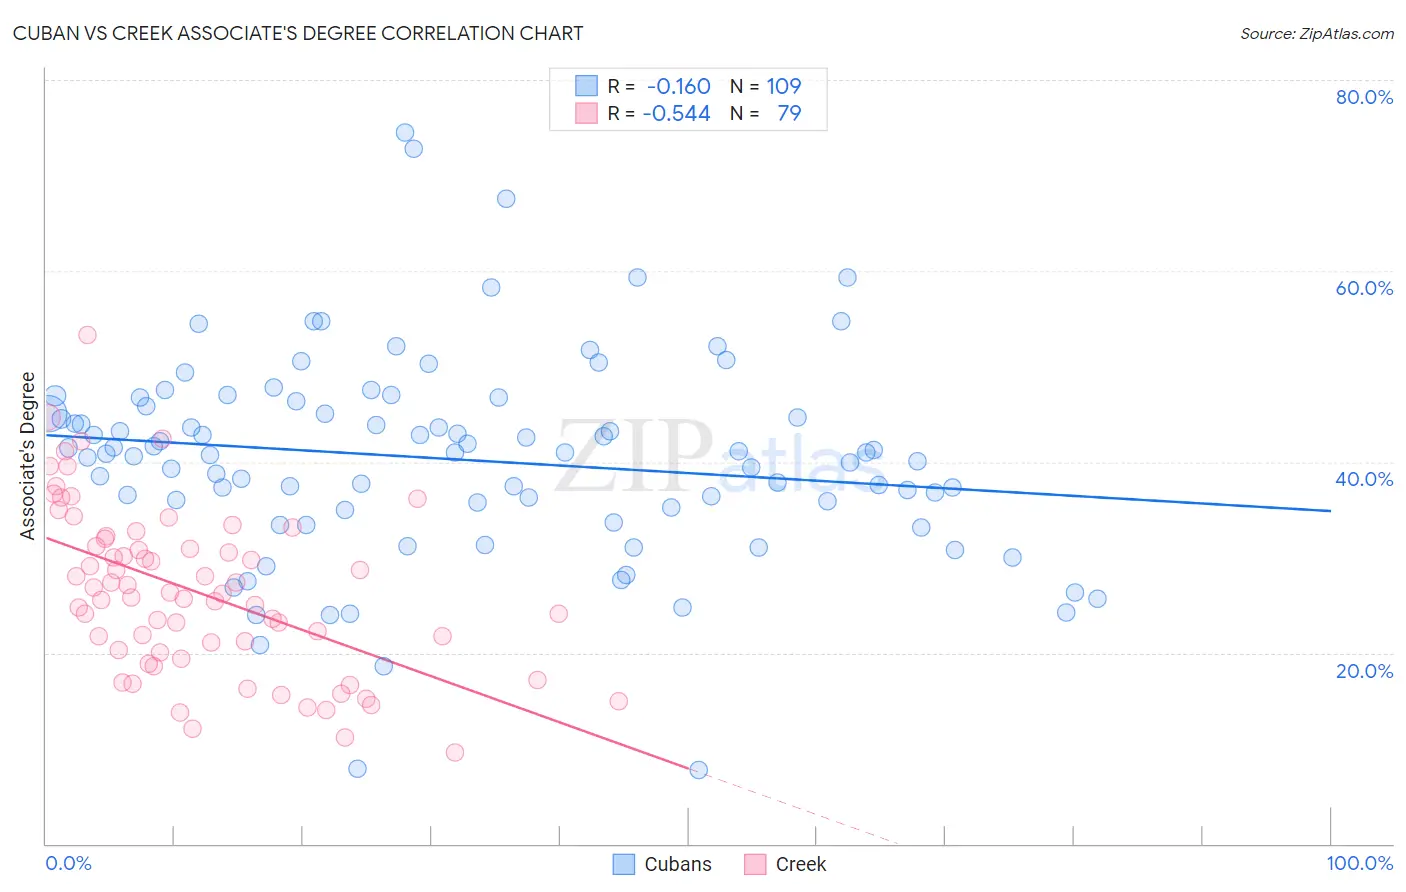
Cuban vs Creek Associate's Degree Correlation Chart
The statistical analysis conducted on geographies consisting of 449,326,407 people shows a poor negative correlation between the proportion of Cubans and percentage of population with at least associate's degree education in the United States with a correlation coefficient (R) of -0.160 and weighted average of 41.9%. Similarly, the statistical analysis conducted on geographies consisting of 178,480,454 people shows a substantial negative correlation between the proportion of Creek and percentage of population with at least associate's degree education in the United States with a correlation coefficient (R) of -0.544 and weighted average of 37.6%, a difference of 11.5%.
Associate's Degree Correlation Summary
| Measurement | Cuban | Creek |
| Minimum | 7.8% | 9.5% |
| Maximum | 74.4% | 53.2% |
| Range | 66.7% | 43.7% |
| Mean | 40.3% | 26.4% |
| Median | 41.0% | 26.2% |
| Interquartile 25% (IQ1) | 35.1% | 20.0% |
| Interquartile 75% (IQ3) | 46.0% | 31.9% |
| Interquartile Range (IQR) | 10.9% | 11.9% |
| Standard Deviation (Sample) | 10.9% | 8.7% |
| Standard Deviation (Population) | 10.8% | 8.7% |
Similar Demographics by Associate's Degree
Demographics Similar to Cubans by Associate's Degree
In terms of associate's degree, the demographic groups most similar to Cubans are Indonesian (41.9%, a difference of 0.060%), Immigrants from Guyana (41.8%, a difference of 0.090%), French American Indian (42.0%, a difference of 0.17%), Immigrants from Congo (41.8%, a difference of 0.21%), and Spanish American (41.8%, a difference of 0.27%).
| Demographics | Rating | Rank | Associate's Degree |
| Immigrants | Fiji | 0.8 /100 | #247 | Tragic 42.2% |
| Immigrants | Ecuador | 0.8 /100 | #248 | Tragic 42.2% |
| Jamaicans | 0.7 /100 | #249 | Tragic 42.1% |
| U.S. Virgin Islanders | 0.7 /100 | #250 | Tragic 42.1% |
| Immigrants | Bahamas | 0.7 /100 | #251 | Tragic 42.1% |
| French American Indians | 0.6 /100 | #252 | Tragic 42.0% |
| Indonesians | 0.6 /100 | #253 | Tragic 41.9% |
| Cubans | 0.6 /100 | #254 | Tragic 41.9% |
| Immigrants | Guyana | 0.5 /100 | #255 | Tragic 41.8% |
| Immigrants | Congo | 0.5 /100 | #256 | Tragic 41.8% |
| Spanish Americans | 0.5 /100 | #257 | Tragic 41.8% |
| Japanese | 0.5 /100 | #258 | Tragic 41.7% |
| Malaysians | 0.4 /100 | #259 | Tragic 41.6% |
| Marshallese | 0.4 /100 | #260 | Tragic 41.6% |
| Nicaraguans | 0.4 /100 | #261 | Tragic 41.5% |
Demographics Similar to Creek by Associate's Degree
In terms of associate's degree, the demographic groups most similar to Creek are Crow (37.6%, a difference of 0.010%), Yaqui (37.6%, a difference of 0.020%), Alaska Native (37.5%, a difference of 0.26%), Seminole (37.7%, a difference of 0.39%), and Hispanic or Latino (37.7%, a difference of 0.44%).
| Demographics | Rating | Rank | Associate's Degree |
| Mexican American Indians | 0.0 /100 | #308 | Tragic 38.2% |
| Immigrants | Guatemala | 0.0 /100 | #309 | Tragic 38.1% |
| Immigrants | Dominican Republic | 0.0 /100 | #310 | Tragic 37.9% |
| Immigrants | Latin America | 0.0 /100 | #311 | Tragic 37.9% |
| Choctaw | 0.0 /100 | #312 | Tragic 37.8% |
| Hispanics or Latinos | 0.0 /100 | #313 | Tragic 37.7% |
| Seminole | 0.0 /100 | #314 | Tragic 37.7% |
| Creek | 0.0 /100 | #315 | Tragic 37.6% |
| Crow | 0.0 /100 | #316 | Tragic 37.6% |
| Yaqui | 0.0 /100 | #317 | Tragic 37.6% |
| Alaska Natives | 0.0 /100 | #318 | Tragic 37.5% |
| Fijians | 0.0 /100 | #319 | Tragic 37.4% |
| Cajuns | 0.0 /100 | #320 | Tragic 37.4% |
| Immigrants | Yemen | 0.0 /100 | #321 | Tragic 37.3% |
| Pennsylvania Germans | 0.0 /100 | #322 | Tragic 37.2% |