Immigrants from Western Africa vs Creek Associate's Degree
COMPARE
Immigrants from Western Africa
Creek
Associate's Degree
Associate's Degree Comparison
Immigrants from Western Africa
Creek
44.1%
ASSOCIATE'S DEGREE
6.6/ 100
METRIC RATING
221st/ 347
METRIC RANK
37.6%
ASSOCIATE'S DEGREE
0.0/ 100
METRIC RATING
315th/ 347
METRIC RANK
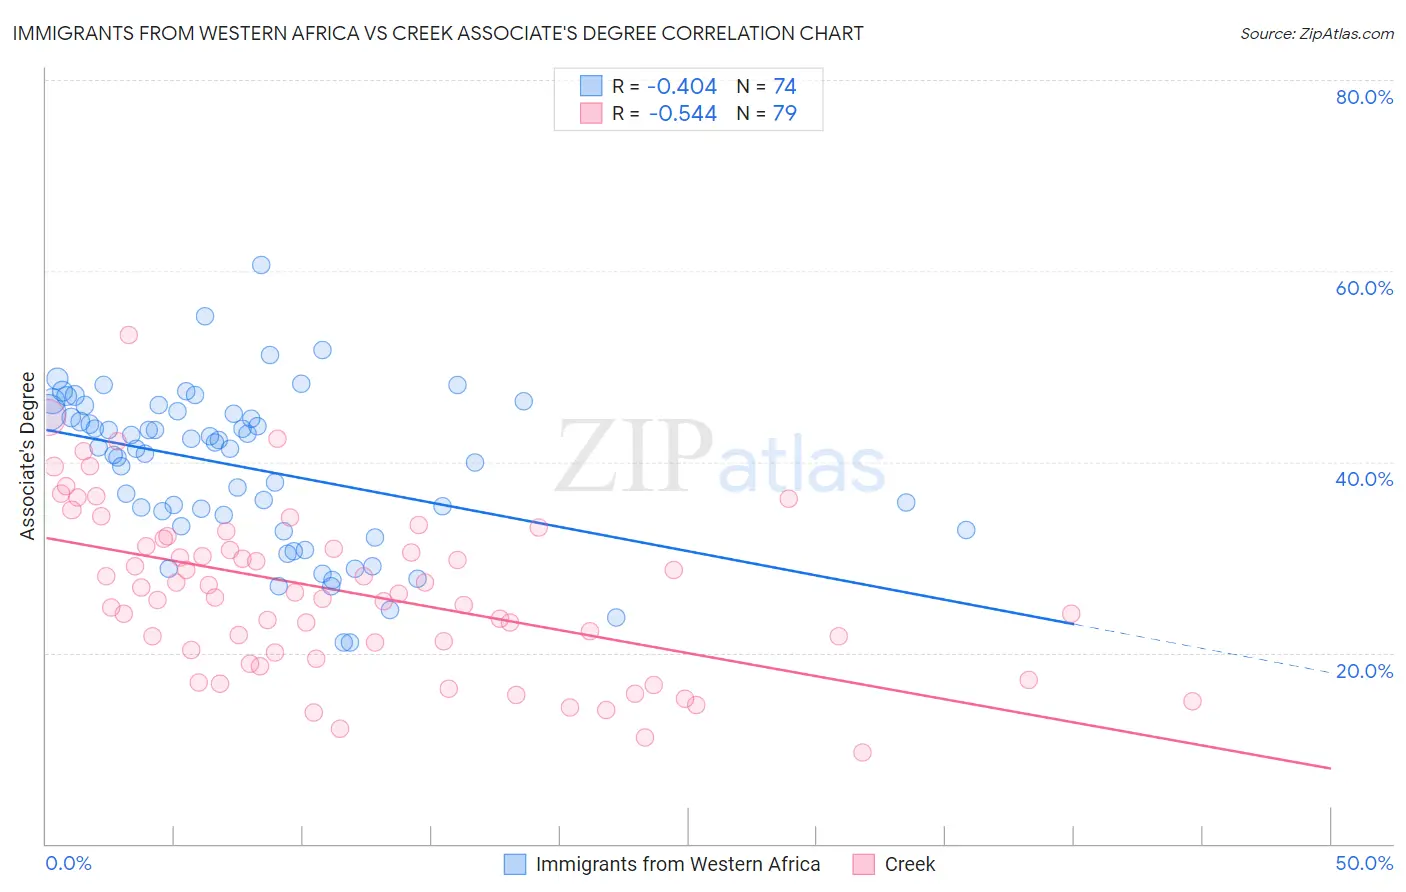
Immigrants from Western Africa vs Creek Associate's Degree Correlation Chart
The statistical analysis conducted on geographies consisting of 357,851,677 people shows a moderate negative correlation between the proportion of Immigrants from Western Africa and percentage of population with at least associate's degree education in the United States with a correlation coefficient (R) of -0.404 and weighted average of 44.1%. Similarly, the statistical analysis conducted on geographies consisting of 178,480,454 people shows a substantial negative correlation between the proportion of Creek and percentage of population with at least associate's degree education in the United States with a correlation coefficient (R) of -0.544 and weighted average of 37.6%, a difference of 17.3%.
Associate's Degree Correlation Summary
| Measurement | Immigrants from Western Africa | Creek |
| Minimum | 21.0% | 9.5% |
| Maximum | 60.6% | 53.2% |
| Range | 39.6% | 43.7% |
| Mean | 39.4% | 26.4% |
| Median | 41.4% | 26.2% |
| Interquartile 25% (IQ1) | 33.2% | 20.0% |
| Interquartile 75% (IQ3) | 45.1% | 31.9% |
| Interquartile Range (IQR) | 11.9% | 11.9% |
| Standard Deviation (Sample) | 8.2% | 8.7% |
| Standard Deviation (Population) | 8.1% | 8.7% |
Similar Demographics by Associate's Degree
Demographics Similar to Immigrants from Western Africa by Associate's Degree
In terms of associate's degree, the demographic groups most similar to Immigrants from Western Africa are Portuguese (44.1%, a difference of 0.20%), White/Caucasian (44.2%, a difference of 0.27%), Barbadian (43.9%, a difference of 0.27%), Subsaharan African (43.9%, a difference of 0.37%), and West Indian (43.8%, a difference of 0.51%).
| Demographics | Rating | Rank | Associate's Degree |
| Immigrants | Middle Africa | 12.7 /100 | #214 | Poor 44.7% |
| Immigrants | Panama | 12.4 /100 | #215 | Poor 44.7% |
| Immigrants | Nigeria | 11.4 /100 | #216 | Poor 44.6% |
| Immigrants | Immigrants | 10.5 /100 | #217 | Poor 44.5% |
| Spanish | 9.4 /100 | #218 | Tragic 44.4% |
| Whites/Caucasians | 7.5 /100 | #219 | Tragic 44.2% |
| Portuguese | 7.2 /100 | #220 | Tragic 44.1% |
| Immigrants | Western Africa | 6.6 /100 | #221 | Tragic 44.1% |
| Barbadians | 5.8 /100 | #222 | Tragic 43.9% |
| Sub-Saharan Africans | 5.5 /100 | #223 | Tragic 43.9% |
| West Indians | 5.2 /100 | #224 | Tragic 43.8% |
| Guamanians/Chamorros | 4.8 /100 | #225 | Tragic 43.8% |
| Immigrants | Burma/Myanmar | 4.3 /100 | #226 | Tragic 43.7% |
| Trinidadians and Tobagonians | 4.0 /100 | #227 | Tragic 43.6% |
| Hmong | 3.2 /100 | #228 | Tragic 43.4% |
Demographics Similar to Creek by Associate's Degree
In terms of associate's degree, the demographic groups most similar to Creek are Crow (37.6%, a difference of 0.010%), Yaqui (37.6%, a difference of 0.020%), Alaska Native (37.5%, a difference of 0.26%), Seminole (37.7%, a difference of 0.39%), and Hispanic or Latino (37.7%, a difference of 0.44%).
| Demographics | Rating | Rank | Associate's Degree |
| Mexican American Indians | 0.0 /100 | #308 | Tragic 38.2% |
| Immigrants | Guatemala | 0.0 /100 | #309 | Tragic 38.1% |
| Immigrants | Dominican Republic | 0.0 /100 | #310 | Tragic 37.9% |
| Immigrants | Latin America | 0.0 /100 | #311 | Tragic 37.9% |
| Choctaw | 0.0 /100 | #312 | Tragic 37.8% |
| Hispanics or Latinos | 0.0 /100 | #313 | Tragic 37.7% |
| Seminole | 0.0 /100 | #314 | Tragic 37.7% |
| Creek | 0.0 /100 | #315 | Tragic 37.6% |
| Crow | 0.0 /100 | #316 | Tragic 37.6% |
| Yaqui | 0.0 /100 | #317 | Tragic 37.6% |
| Alaska Natives | 0.0 /100 | #318 | Tragic 37.5% |
| Fijians | 0.0 /100 | #319 | Tragic 37.4% |
| Cajuns | 0.0 /100 | #320 | Tragic 37.4% |
| Immigrants | Yemen | 0.0 /100 | #321 | Tragic 37.3% |
| Pennsylvania Germans | 0.0 /100 | #322 | Tragic 37.2% |