U.S. Virgin Islander vs British West Indian 6th Grade
COMPARE
U.S. Virgin Islander
British West Indian
6th Grade
6th Grade Comparison
U.S. Virgin Islanders
British West Indians
96.5%
6TH GRADE
0.5/ 100
METRIC RATING
256th/ 347
METRIC RANK
96.0%
6TH GRADE
0.0/ 100
METRIC RATING
294th/ 347
METRIC RANK
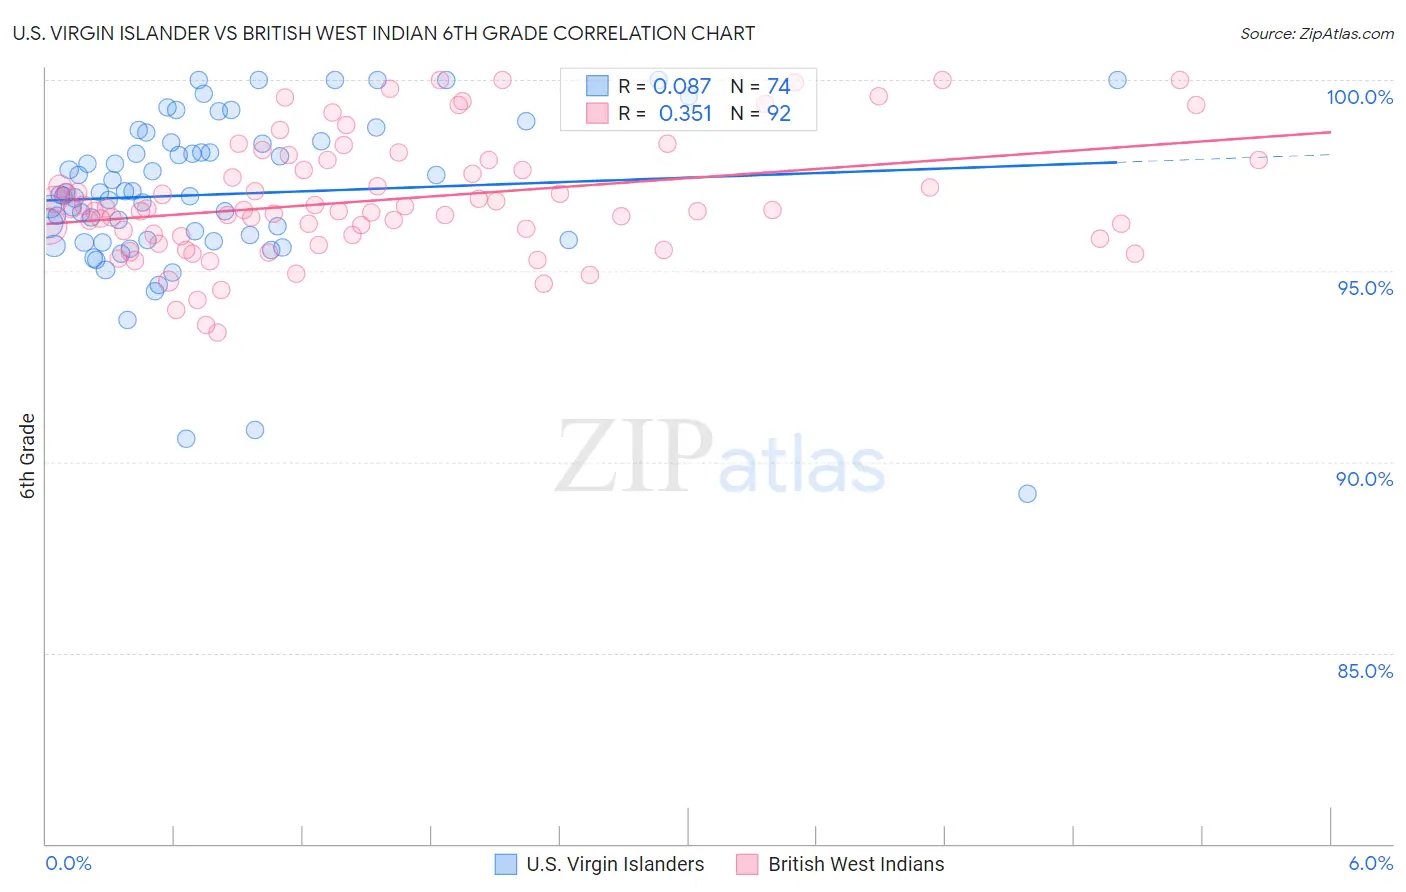
U.S. Virgin Islander vs British West Indian 6th Grade Correlation Chart
The statistical analysis conducted on geographies consisting of 87,529,315 people shows a slight positive correlation between the proportion of U.S. Virgin Islanders and percentage of population with at least 6th grade education in the United States with a correlation coefficient (R) of 0.087 and weighted average of 96.5%. Similarly, the statistical analysis conducted on geographies consisting of 152,691,173 people shows a mild positive correlation between the proportion of British West Indians and percentage of population with at least 6th grade education in the United States with a correlation coefficient (R) of 0.351 and weighted average of 96.0%, a difference of 0.49%.
6th Grade Correlation Summary
| Measurement | U.S. Virgin Islander | British West Indian |
| Minimum | 89.2% | 93.4% |
| Maximum | 100.0% | 100.0% |
| Range | 10.8% | 6.6% |
| Mean | 97.0% | 96.9% |
| Median | 97.0% | 96.6% |
| Interquartile 25% (IQ1) | 95.8% | 95.9% |
| Interquartile 75% (IQ3) | 98.4% | 97.9% |
| Interquartile Range (IQR) | 2.6% | 2.0% |
| Standard Deviation (Sample) | 2.1% | 1.6% |
| Standard Deviation (Population) | 2.1% | 1.5% |
Similar Demographics by 6th Grade
Demographics Similar to U.S. Virgin Islanders by 6th Grade
In terms of 6th grade, the demographic groups most similar to U.S. Virgin Islanders are Jamaican (96.5%, a difference of 0.010%), Immigrants from Ethiopia (96.5%, a difference of 0.010%), Immigrants from Congo (96.5%, a difference of 0.010%), Immigrants from Senegal (96.5%, a difference of 0.020%), and Immigrants from Uruguay (96.5%, a difference of 0.020%).
| Demographics | Rating | Rank | 6th Grade |
| Colombians | 0.9 /100 | #249 | Tragic 96.5% |
| Immigrants | Middle Africa | 0.8 /100 | #250 | Tragic 96.5% |
| Immigrants | Senegal | 0.7 /100 | #251 | Tragic 96.5% |
| Immigrants | Uruguay | 0.6 /100 | #252 | Tragic 96.5% |
| Jamaicans | 0.6 /100 | #253 | Tragic 96.5% |
| Immigrants | Ethiopia | 0.6 /100 | #254 | Tragic 96.5% |
| Immigrants | Congo | 0.6 /100 | #255 | Tragic 96.5% |
| U.S. Virgin Islanders | 0.5 /100 | #256 | Tragic 96.5% |
| Taiwanese | 0.5 /100 | #257 | Tragic 96.5% |
| Immigrants | China | 0.4 /100 | #258 | Tragic 96.4% |
| South Americans | 0.4 /100 | #259 | Tragic 96.4% |
| Peruvians | 0.4 /100 | #260 | Tragic 96.4% |
| Immigrants | Sierra Leone | 0.4 /100 | #261 | Tragic 96.4% |
| Immigrants | Nigeria | 0.3 /100 | #262 | Tragic 96.4% |
| Immigrants | Colombia | 0.3 /100 | #263 | Tragic 96.4% |
Demographics Similar to British West Indians by 6th Grade
In terms of 6th grade, the demographic groups most similar to British West Indians are Immigrants from West Indies (96.1%, a difference of 0.070%), Immigrants from Grenada (95.9%, a difference of 0.070%), Immigrants from South Eastern Asia (95.9%, a difference of 0.070%), Immigrants from Barbados (96.1%, a difference of 0.10%), and Immigrants from St. Vincent and the Grenadines (96.1%, a difference of 0.12%).
| Demographics | Rating | Rank | 6th Grade |
| Immigrants | Trinidad and Tobago | 0.0 /100 | #287 | Tragic 96.2% |
| Malaysians | 0.0 /100 | #288 | Tragic 96.2% |
| Immigrants | Eritrea | 0.0 /100 | #289 | Tragic 96.1% |
| Immigrants | Somalia | 0.0 /100 | #290 | Tragic 96.1% |
| Immigrants | St. Vincent and the Grenadines | 0.0 /100 | #291 | Tragic 96.1% |
| Immigrants | Barbados | 0.0 /100 | #292 | Tragic 96.1% |
| Immigrants | West Indies | 0.0 /100 | #293 | Tragic 96.1% |
| British West Indians | 0.0 /100 | #294 | Tragic 96.0% |
| Immigrants | Grenada | 0.0 /100 | #295 | Tragic 95.9% |
| Immigrants | South Eastern Asia | 0.0 /100 | #296 | Tragic 95.9% |
| Haitians | 0.0 /100 | #297 | Tragic 95.8% |
| Sri Lankans | 0.0 /100 | #298 | Tragic 95.8% |
| Immigrants | Laos | 0.0 /100 | #299 | Tragic 95.7% |
| Immigrants | Dominica | 0.0 /100 | #300 | Tragic 95.7% |
| Immigrants | Immigrants | 0.0 /100 | #301 | Tragic 95.7% |