Comanche vs British West Indian 6th Grade
COMPARE
Comanche
British West Indian
6th Grade
6th Grade Comparison
Comanche
British West Indians
97.0%
6TH GRADE
37.9/ 100
METRIC RATING
181st/ 347
METRIC RANK
96.0%
6TH GRADE
0.0/ 100
METRIC RATING
294th/ 347
METRIC RANK
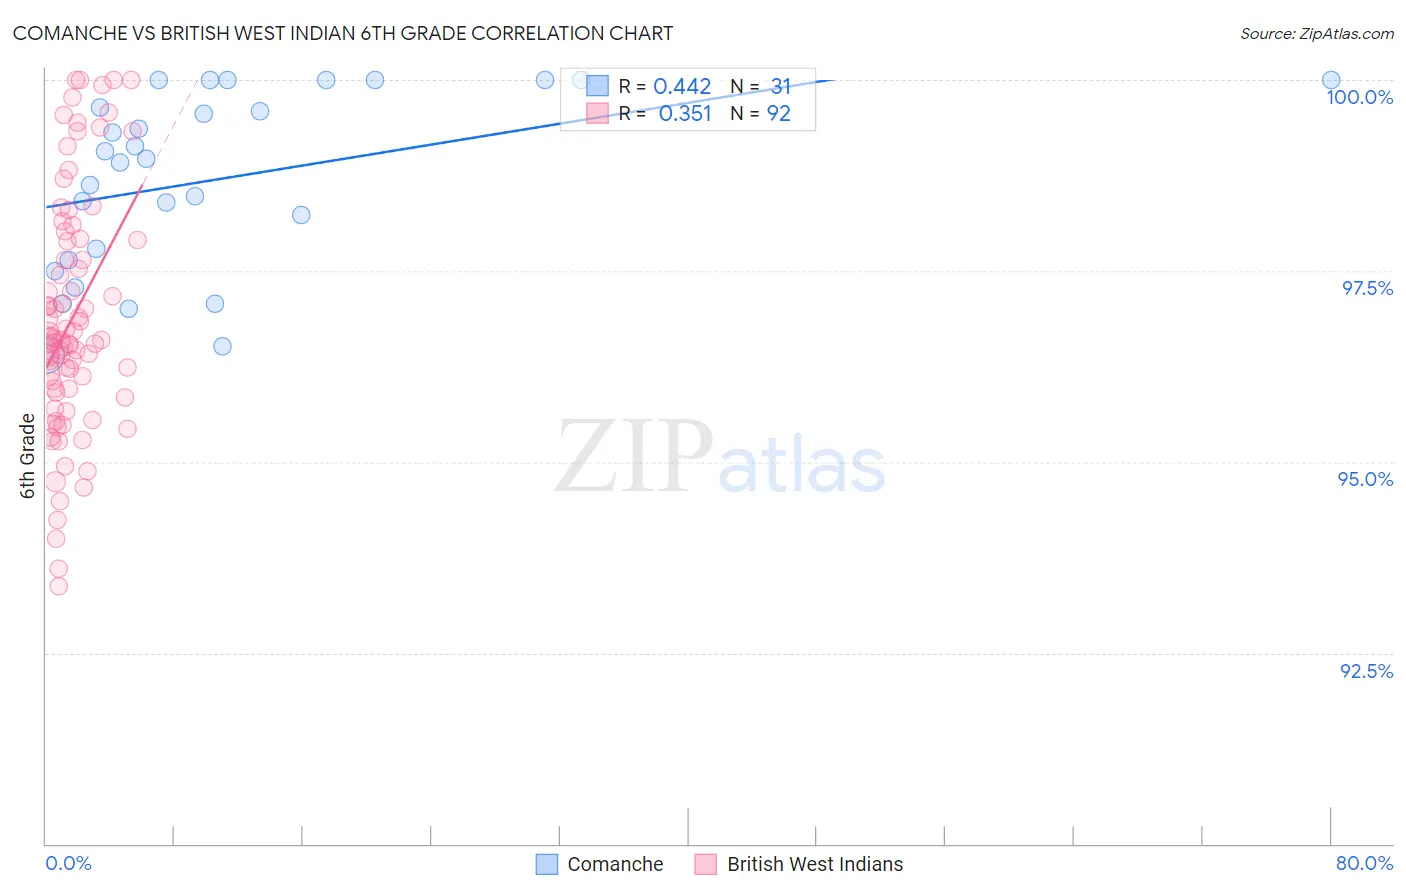
Comanche vs British West Indian 6th Grade Correlation Chart
The statistical analysis conducted on geographies consisting of 109,786,530 people shows a moderate positive correlation between the proportion of Comanche and percentage of population with at least 6th grade education in the United States with a correlation coefficient (R) of 0.442 and weighted average of 97.0%. Similarly, the statistical analysis conducted on geographies consisting of 152,691,173 people shows a mild positive correlation between the proportion of British West Indians and percentage of population with at least 6th grade education in the United States with a correlation coefficient (R) of 0.351 and weighted average of 96.0%, a difference of 1.0%.
6th Grade Correlation Summary
| Measurement | Comanche | British West Indian |
| Minimum | 96.4% | 93.4% |
| Maximum | 100.0% | 100.0% |
| Range | 3.6% | 6.6% |
| Mean | 98.7% | 96.9% |
| Median | 99.0% | 96.6% |
| Interquartile 25% (IQ1) | 97.6% | 95.9% |
| Interquartile 75% (IQ3) | 100.0% | 97.9% |
| Interquartile Range (IQR) | 2.4% | 2.0% |
| Standard Deviation (Sample) | 1.2% | 1.6% |
| Standard Deviation (Population) | 1.2% | 1.5% |
Similar Demographics by 6th Grade
Demographics Similar to Comanche by 6th Grade
In terms of 6th grade, the demographic groups most similar to Comanche are Immigrants from Spain (97.0%, a difference of 0.010%), Immigrants from Ukraine (97.0%, a difference of 0.010%), Immigrants from Venezuela (97.0%, a difference of 0.020%), Spanish American (97.0%, a difference of 0.020%), and Argentinean (97.0%, a difference of 0.020%).
| Demographics | Rating | Rank | 6th Grade |
| Venezuelans | 50.0 /100 | #174 | Average 97.0% |
| Immigrants | Kazakhstan | 47.3 /100 | #175 | Average 97.0% |
| Immigrants | Micronesia | 47.1 /100 | #176 | Average 97.0% |
| Mongolians | 46.7 /100 | #177 | Average 97.0% |
| Pakistanis | 46.0 /100 | #178 | Average 97.0% |
| Immigrants | Kenya | 45.3 /100 | #179 | Average 97.0% |
| Immigrants | Spain | 39.9 /100 | #180 | Fair 97.0% |
| Comanche | 37.9 /100 | #181 | Fair 97.0% |
| Immigrants | Ukraine | 35.6 /100 | #182 | Fair 97.0% |
| Immigrants | Venezuela | 34.5 /100 | #183 | Fair 97.0% |
| Spanish Americans | 33.5 /100 | #184 | Fair 97.0% |
| Argentineans | 33.0 /100 | #185 | Fair 97.0% |
| Immigrants | Egypt | 31.4 /100 | #186 | Fair 97.0% |
| Guamanians/Chamorros | 30.6 /100 | #187 | Fair 97.0% |
| Immigrants | Argentina | 30.4 /100 | #188 | Fair 97.0% |
Demographics Similar to British West Indians by 6th Grade
In terms of 6th grade, the demographic groups most similar to British West Indians are Immigrants from West Indies (96.1%, a difference of 0.070%), Immigrants from Grenada (95.9%, a difference of 0.070%), Immigrants from South Eastern Asia (95.9%, a difference of 0.070%), Immigrants from Barbados (96.1%, a difference of 0.10%), and Immigrants from St. Vincent and the Grenadines (96.1%, a difference of 0.12%).
| Demographics | Rating | Rank | 6th Grade |
| Immigrants | Trinidad and Tobago | 0.0 /100 | #287 | Tragic 96.2% |
| Malaysians | 0.0 /100 | #288 | Tragic 96.2% |
| Immigrants | Eritrea | 0.0 /100 | #289 | Tragic 96.1% |
| Immigrants | Somalia | 0.0 /100 | #290 | Tragic 96.1% |
| Immigrants | St. Vincent and the Grenadines | 0.0 /100 | #291 | Tragic 96.1% |
| Immigrants | Barbados | 0.0 /100 | #292 | Tragic 96.1% |
| Immigrants | West Indies | 0.0 /100 | #293 | Tragic 96.1% |
| British West Indians | 0.0 /100 | #294 | Tragic 96.0% |
| Immigrants | Grenada | 0.0 /100 | #295 | Tragic 95.9% |
| Immigrants | South Eastern Asia | 0.0 /100 | #296 | Tragic 95.9% |
| Haitians | 0.0 /100 | #297 | Tragic 95.8% |
| Sri Lankans | 0.0 /100 | #298 | Tragic 95.8% |
| Immigrants | Laos | 0.0 /100 | #299 | Tragic 95.7% |
| Immigrants | Dominica | 0.0 /100 | #300 | Tragic 95.7% |
| Immigrants | Immigrants | 0.0 /100 | #301 | Tragic 95.7% |