Albanian vs British West Indian 6th Grade
COMPARE
Albanian
British West Indian
6th Grade
6th Grade Comparison
Albanians
British West Indians
97.1%
6TH GRADE
57.8/ 100
METRIC RATING
163rd/ 347
METRIC RANK
96.0%
6TH GRADE
0.0/ 100
METRIC RATING
294th/ 347
METRIC RANK
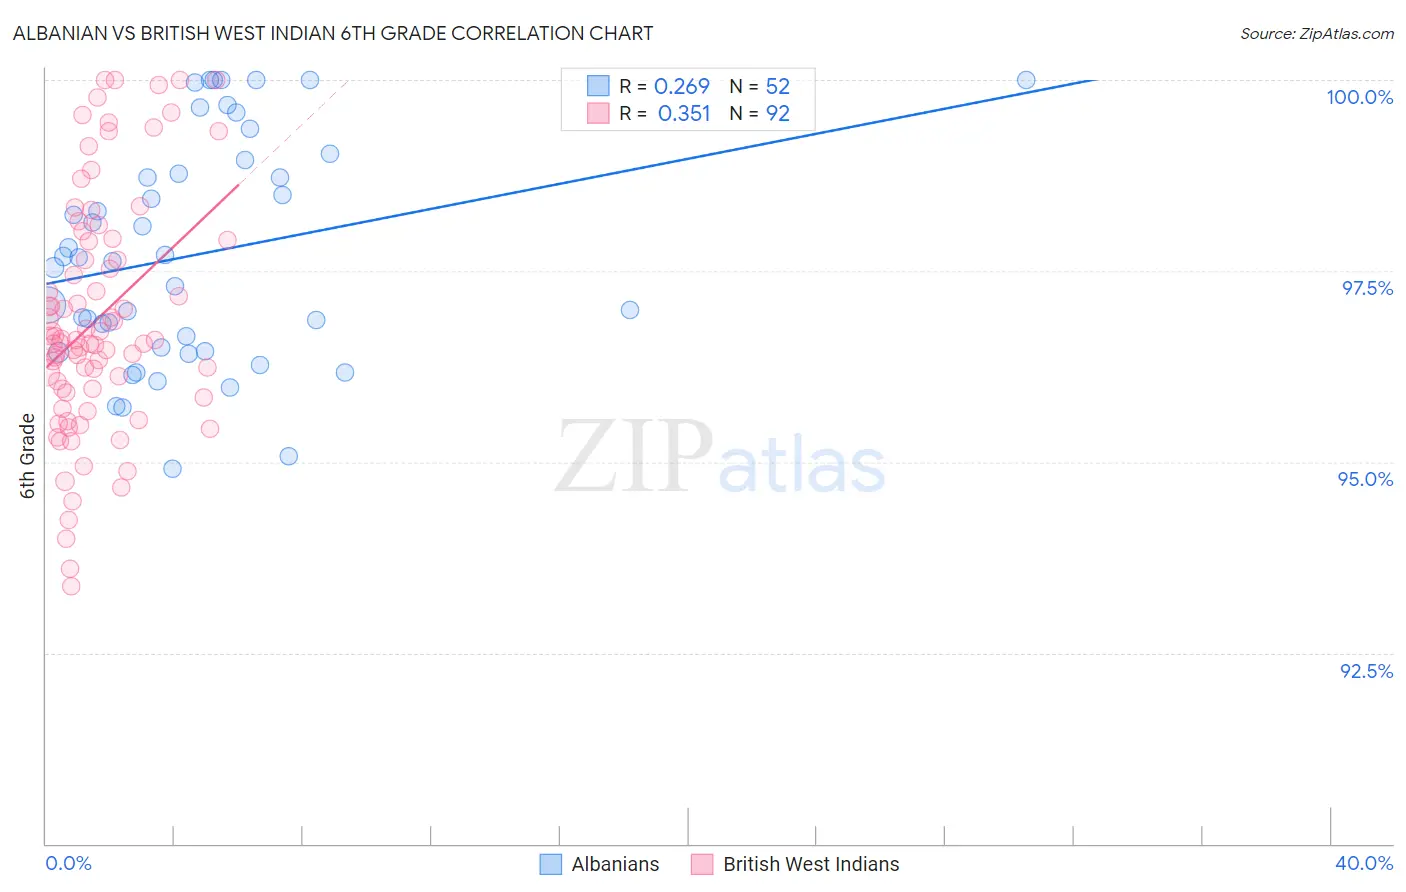
Albanian vs British West Indian 6th Grade Correlation Chart
The statistical analysis conducted on geographies consisting of 193,265,850 people shows a weak positive correlation between the proportion of Albanians and percentage of population with at least 6th grade education in the United States with a correlation coefficient (R) of 0.269 and weighted average of 97.1%. Similarly, the statistical analysis conducted on geographies consisting of 152,691,173 people shows a mild positive correlation between the proportion of British West Indians and percentage of population with at least 6th grade education in the United States with a correlation coefficient (R) of 0.351 and weighted average of 96.0%, a difference of 1.1%.
6th Grade Correlation Summary
| Measurement | Albanian | British West Indian |
| Minimum | 94.9% | 93.4% |
| Maximum | 100.0% | 100.0% |
| Range | 5.1% | 6.6% |
| Mean | 97.7% | 96.9% |
| Median | 97.7% | 96.6% |
| Interquartile 25% (IQ1) | 96.5% | 95.9% |
| Interquartile 75% (IQ3) | 98.9% | 97.9% |
| Interquartile Range (IQR) | 2.4% | 2.0% |
| Standard Deviation (Sample) | 1.5% | 1.6% |
| Standard Deviation (Population) | 1.5% | 1.5% |
Similar Demographics by 6th Grade
Demographics Similar to Albanians by 6th Grade
In terms of 6th grade, the demographic groups most similar to Albanians are Immigrants from Korea (97.1%, a difference of 0.0%), Immigrants from Belarus (97.1%, a difference of 0.010%), Marshallese (97.1%, a difference of 0.010%), Immigrants from Poland (97.1%, a difference of 0.010%), and Kenyan (97.1%, a difference of 0.020%).
| Demographics | Rating | Rank | 6th Grade |
| Alsatians | 69.8 /100 | #156 | Good 97.1% |
| Immigrants | Russia | 67.6 /100 | #157 | Good 97.1% |
| Immigrants | Iran | 63.3 /100 | #158 | Good 97.1% |
| Kenyans | 62.9 /100 | #159 | Good 97.1% |
| Ugandans | 62.2 /100 | #160 | Good 97.1% |
| Immigrants | Belarus | 60.4 /100 | #161 | Good 97.1% |
| Marshallese | 60.2 /100 | #162 | Good 97.1% |
| Albanians | 57.8 /100 | #163 | Average 97.1% |
| Immigrants | Korea | 57.7 /100 | #164 | Average 97.1% |
| Immigrants | Poland | 56.2 /100 | #165 | Average 97.1% |
| Immigrants | Italy | 53.8 /100 | #166 | Average 97.1% |
| Apache | 53.6 /100 | #167 | Average 97.1% |
| Immigrants | Taiwan | 53.5 /100 | #168 | Average 97.1% |
| Bermudans | 52.6 /100 | #169 | Average 97.1% |
| Chileans | 52.1 /100 | #170 | Average 97.1% |
Demographics Similar to British West Indians by 6th Grade
In terms of 6th grade, the demographic groups most similar to British West Indians are Immigrants from West Indies (96.1%, a difference of 0.070%), Immigrants from Grenada (95.9%, a difference of 0.070%), Immigrants from South Eastern Asia (95.9%, a difference of 0.070%), Immigrants from Barbados (96.1%, a difference of 0.10%), and Immigrants from St. Vincent and the Grenadines (96.1%, a difference of 0.12%).
| Demographics | Rating | Rank | 6th Grade |
| Immigrants | Trinidad and Tobago | 0.0 /100 | #287 | Tragic 96.2% |
| Malaysians | 0.0 /100 | #288 | Tragic 96.2% |
| Immigrants | Eritrea | 0.0 /100 | #289 | Tragic 96.1% |
| Immigrants | Somalia | 0.0 /100 | #290 | Tragic 96.1% |
| Immigrants | St. Vincent and the Grenadines | 0.0 /100 | #291 | Tragic 96.1% |
| Immigrants | Barbados | 0.0 /100 | #292 | Tragic 96.1% |
| Immigrants | West Indies | 0.0 /100 | #293 | Tragic 96.1% |
| British West Indians | 0.0 /100 | #294 | Tragic 96.0% |
| Immigrants | Grenada | 0.0 /100 | #295 | Tragic 95.9% |
| Immigrants | South Eastern Asia | 0.0 /100 | #296 | Tragic 95.9% |
| Haitians | 0.0 /100 | #297 | Tragic 95.8% |
| Sri Lankans | 0.0 /100 | #298 | Tragic 95.8% |
| Immigrants | Laos | 0.0 /100 | #299 | Tragic 95.7% |
| Immigrants | Dominica | 0.0 /100 | #300 | Tragic 95.7% |
| Immigrants | Immigrants | 0.0 /100 | #301 | Tragic 95.7% |