Cheyenne vs British West Indian 6th Grade
COMPARE
Cheyenne
British West Indian
6th Grade
6th Grade Comparison
Cheyenne
British West Indians
97.5%
6TH GRADE
97.9/ 100
METRIC RATING
105th/ 347
METRIC RANK
96.0%
6TH GRADE
0.0/ 100
METRIC RATING
294th/ 347
METRIC RANK
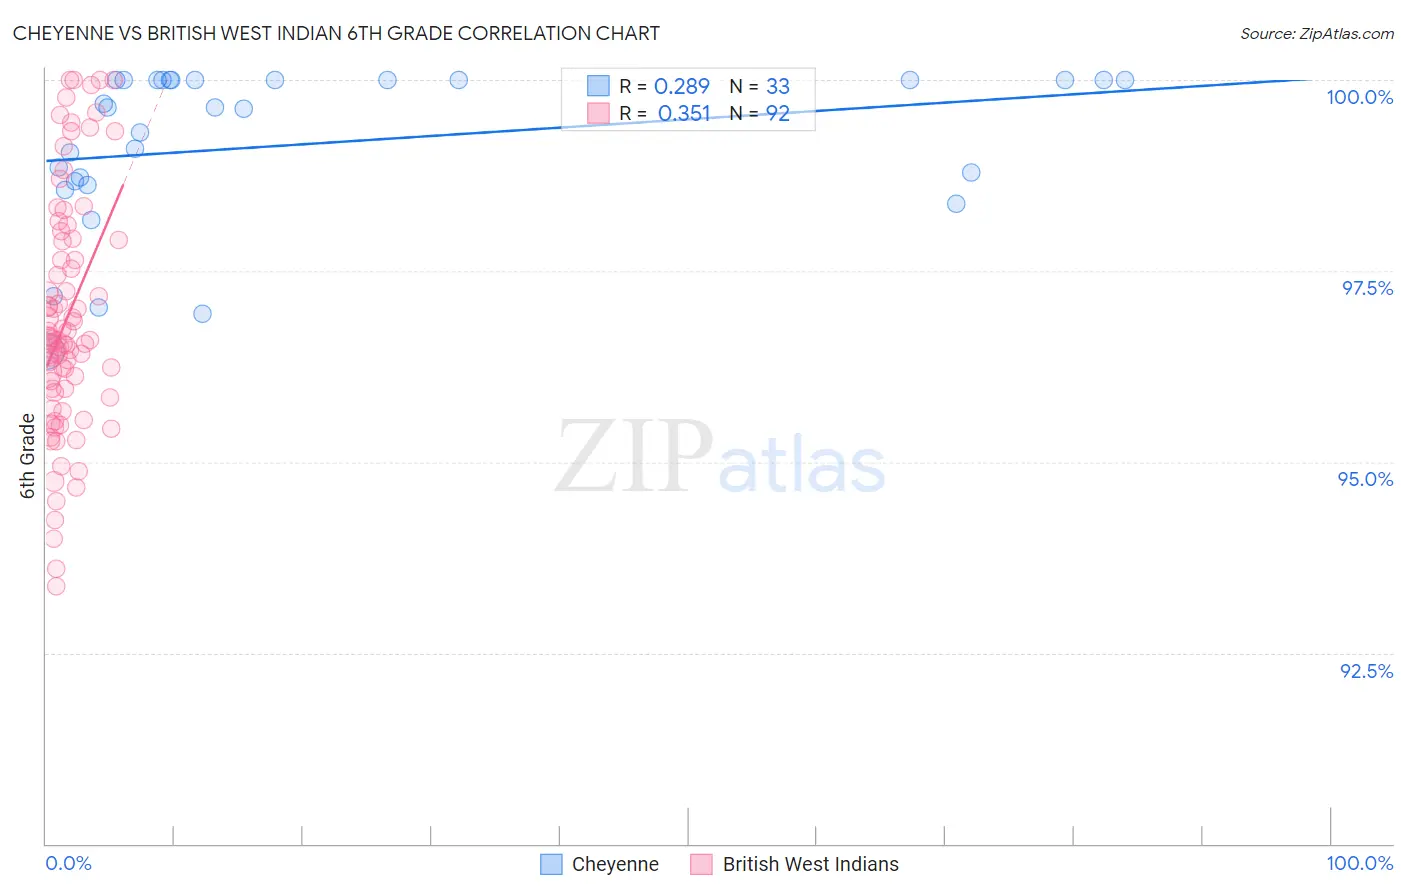
Cheyenne vs British West Indian 6th Grade Correlation Chart
The statistical analysis conducted on geographies consisting of 80,716,760 people shows a weak positive correlation between the proportion of Cheyenne and percentage of population with at least 6th grade education in the United States with a correlation coefficient (R) of 0.289 and weighted average of 97.5%. Similarly, the statistical analysis conducted on geographies consisting of 152,691,173 people shows a mild positive correlation between the proportion of British West Indians and percentage of population with at least 6th grade education in the United States with a correlation coefficient (R) of 0.351 and weighted average of 96.0%, a difference of 1.5%.
6th Grade Correlation Summary
| Measurement | Cheyenne | British West Indian |
| Minimum | 96.5% | 93.4% |
| Maximum | 100.0% | 100.0% |
| Range | 3.5% | 6.6% |
| Mean | 99.2% | 96.9% |
| Median | 99.6% | 96.6% |
| Interquartile 25% (IQ1) | 98.7% | 95.9% |
| Interquartile 75% (IQ3) | 100.0% | 97.9% |
| Interquartile Range (IQR) | 1.3% | 2.0% |
| Standard Deviation (Sample) | 1.0% | 1.6% |
| Standard Deviation (Population) | 1.0% | 1.5% |
Similar Demographics by 6th Grade
Demographics Similar to Cheyenne by 6th Grade
In terms of 6th grade, the demographic groups most similar to Cheyenne are Bhutanese (97.5%, a difference of 0.0%), German Russian (97.5%, a difference of 0.0%), Choctaw (97.5%, a difference of 0.010%), Menominee (97.5%, a difference of 0.010%), and Turkish (97.5%, a difference of 0.020%).
| Demographics | Rating | Rank | 6th Grade |
| Immigrants | Denmark | 98.5 /100 | #98 | Exceptional 97.5% |
| Yugoslavians | 98.5 /100 | #99 | Exceptional 97.5% |
| Turks | 98.3 /100 | #100 | Exceptional 97.5% |
| South Africans | 98.2 /100 | #101 | Exceptional 97.5% |
| Choctaw | 98.0 /100 | #102 | Exceptional 97.5% |
| Bhutanese | 98.0 /100 | #103 | Exceptional 97.5% |
| German Russians | 97.9 /100 | #104 | Exceptional 97.5% |
| Cheyenne | 97.9 /100 | #105 | Exceptional 97.5% |
| Menominee | 97.7 /100 | #106 | Exceptional 97.5% |
| Immigrants | Singapore | 97.6 /100 | #107 | Exceptional 97.5% |
| Immigrants | Nonimmigrants | 97.3 /100 | #108 | Exceptional 97.4% |
| Immigrants | Czechoslovakia | 97.3 /100 | #109 | Exceptional 97.4% |
| Thais | 96.9 /100 | #110 | Exceptional 97.4% |
| Iroquois | 96.9 /100 | #111 | Exceptional 97.4% |
| Immigrants | Latvia | 96.7 /100 | #112 | Exceptional 97.4% |
Demographics Similar to British West Indians by 6th Grade
In terms of 6th grade, the demographic groups most similar to British West Indians are Immigrants from West Indies (96.1%, a difference of 0.070%), Immigrants from Grenada (95.9%, a difference of 0.070%), Immigrants from South Eastern Asia (95.9%, a difference of 0.070%), Immigrants from Barbados (96.1%, a difference of 0.10%), and Immigrants from St. Vincent and the Grenadines (96.1%, a difference of 0.12%).
| Demographics | Rating | Rank | 6th Grade |
| Immigrants | Trinidad and Tobago | 0.0 /100 | #287 | Tragic 96.2% |
| Malaysians | 0.0 /100 | #288 | Tragic 96.2% |
| Immigrants | Eritrea | 0.0 /100 | #289 | Tragic 96.1% |
| Immigrants | Somalia | 0.0 /100 | #290 | Tragic 96.1% |
| Immigrants | St. Vincent and the Grenadines | 0.0 /100 | #291 | Tragic 96.1% |
| Immigrants | Barbados | 0.0 /100 | #292 | Tragic 96.1% |
| Immigrants | West Indies | 0.0 /100 | #293 | Tragic 96.1% |
| British West Indians | 0.0 /100 | #294 | Tragic 96.0% |
| Immigrants | Grenada | 0.0 /100 | #295 | Tragic 95.9% |
| Immigrants | South Eastern Asia | 0.0 /100 | #296 | Tragic 95.9% |
| Haitians | 0.0 /100 | #297 | Tragic 95.8% |
| Sri Lankans | 0.0 /100 | #298 | Tragic 95.8% |
| Immigrants | Laos | 0.0 /100 | #299 | Tragic 95.7% |
| Immigrants | Dominica | 0.0 /100 | #300 | Tragic 95.7% |
| Immigrants | Immigrants | 0.0 /100 | #301 | Tragic 95.7% |