U.S. Virgin Islander vs Immigrants from Hungary 6th Grade
COMPARE
U.S. Virgin Islander
Immigrants from Hungary
6th Grade
6th Grade Comparison
U.S. Virgin Islanders
Immigrants from Hungary
96.5%
6TH GRADE
0.5/ 100
METRIC RATING
256th/ 347
METRIC RANK
97.3%
6TH GRADE
89.5/ 100
METRIC RATING
135th/ 347
METRIC RANK
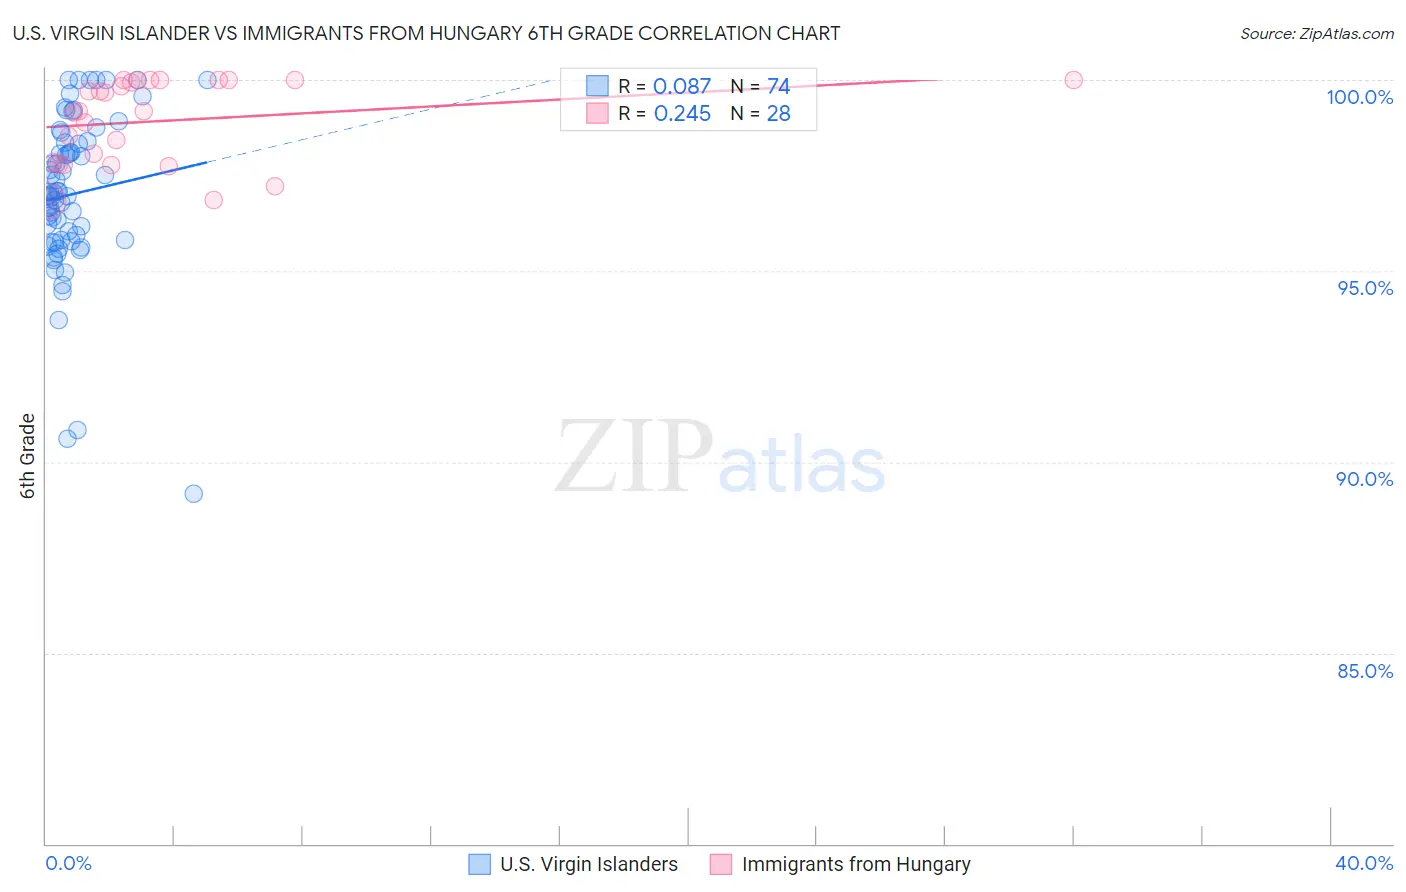
U.S. Virgin Islander vs Immigrants from Hungary 6th Grade Correlation Chart
The statistical analysis conducted on geographies consisting of 87,529,315 people shows a slight positive correlation between the proportion of U.S. Virgin Islanders and percentage of population with at least 6th grade education in the United States with a correlation coefficient (R) of 0.087 and weighted average of 96.5%. Similarly, the statistical analysis conducted on geographies consisting of 195,707,305 people shows a weak positive correlation between the proportion of Immigrants from Hungary and percentage of population with at least 6th grade education in the United States with a correlation coefficient (R) of 0.245 and weighted average of 97.3%, a difference of 0.84%.
6th Grade Correlation Summary
| Measurement | U.S. Virgin Islander | Immigrants from Hungary |
| Minimum | 89.2% | 96.8% |
| Maximum | 100.0% | 100.0% |
| Range | 10.8% | 3.2% |
| Mean | 97.0% | 98.9% |
| Median | 97.0% | 99.2% |
| Interquartile 25% (IQ1) | 95.8% | 97.8% |
| Interquartile 75% (IQ3) | 98.4% | 100.0% |
| Interquartile Range (IQR) | 2.6% | 2.2% |
| Standard Deviation (Sample) | 2.1% | 1.1% |
| Standard Deviation (Population) | 2.1% | 1.1% |
Similar Demographics by 6th Grade
Demographics Similar to U.S. Virgin Islanders by 6th Grade
In terms of 6th grade, the demographic groups most similar to U.S. Virgin Islanders are Jamaican (96.5%, a difference of 0.010%), Immigrants from Ethiopia (96.5%, a difference of 0.010%), Immigrants from Congo (96.5%, a difference of 0.010%), Immigrants from Senegal (96.5%, a difference of 0.020%), and Immigrants from Uruguay (96.5%, a difference of 0.020%).
| Demographics | Rating | Rank | 6th Grade |
| Colombians | 0.9 /100 | #249 | Tragic 96.5% |
| Immigrants | Middle Africa | 0.8 /100 | #250 | Tragic 96.5% |
| Immigrants | Senegal | 0.7 /100 | #251 | Tragic 96.5% |
| Immigrants | Uruguay | 0.6 /100 | #252 | Tragic 96.5% |
| Jamaicans | 0.6 /100 | #253 | Tragic 96.5% |
| Immigrants | Ethiopia | 0.6 /100 | #254 | Tragic 96.5% |
| Immigrants | Congo | 0.6 /100 | #255 | Tragic 96.5% |
| U.S. Virgin Islanders | 0.5 /100 | #256 | Tragic 96.5% |
| Taiwanese | 0.5 /100 | #257 | Tragic 96.5% |
| Immigrants | China | 0.4 /100 | #258 | Tragic 96.4% |
| South Americans | 0.4 /100 | #259 | Tragic 96.4% |
| Peruvians | 0.4 /100 | #260 | Tragic 96.4% |
| Immigrants | Sierra Leone | 0.4 /100 | #261 | Tragic 96.4% |
| Immigrants | Nigeria | 0.3 /100 | #262 | Tragic 96.4% |
| Immigrants | Colombia | 0.3 /100 | #263 | Tragic 96.4% |
Demographics Similar to Immigrants from Hungary by 6th Grade
In terms of 6th grade, the demographic groups most similar to Immigrants from Hungary are Immigrants from Kuwait (97.3%, a difference of 0.0%), Immigrants from Moldova (97.3%, a difference of 0.010%), Filipino (97.3%, a difference of 0.010%), Immigrants from Europe (97.3%, a difference of 0.020%), and Palestinian (97.3%, a difference of 0.020%).
| Demographics | Rating | Rank | 6th Grade |
| Immigrants | Romania | 92.0 /100 | #128 | Exceptional 97.3% |
| Immigrants | Serbia | 91.9 /100 | #129 | Exceptional 97.3% |
| Cambodians | 91.8 /100 | #130 | Exceptional 97.3% |
| Immigrants | Europe | 91.1 /100 | #131 | Exceptional 97.3% |
| Palestinians | 90.9 /100 | #132 | Exceptional 97.3% |
| Immigrants | Moldova | 90.0 /100 | #133 | Excellent 97.3% |
| Immigrants | Kuwait | 89.5 /100 | #134 | Excellent 97.3% |
| Immigrants | Hungary | 89.5 /100 | #135 | Excellent 97.3% |
| Filipinos | 88.9 /100 | #136 | Excellent 97.3% |
| Burmese | 87.8 /100 | #137 | Excellent 97.3% |
| Blackfeet | 87.7 /100 | #138 | Excellent 97.3% |
| Immigrants | Turkey | 86.1 /100 | #139 | Excellent 97.3% |
| Immigrants | North Macedonia | 85.5 /100 | #140 | Excellent 97.2% |
| Seminole | 84.8 /100 | #141 | Excellent 97.2% |
| Jordanians | 84.6 /100 | #142 | Excellent 97.2% |