Uruguayan vs African College, 1 year or more
COMPARE
Uruguayan
African
College, 1 year or more
College, 1 year or more Comparison
Uruguayans
Africans
58.8%
COLLEGE, 1 YEAR OR MORE
31.8/ 100
METRIC RATING
189th/ 347
METRIC RANK
55.0%
COLLEGE, 1 YEAR OR MORE
0.4/ 100
METRIC RATING
258th/ 347
METRIC RANK
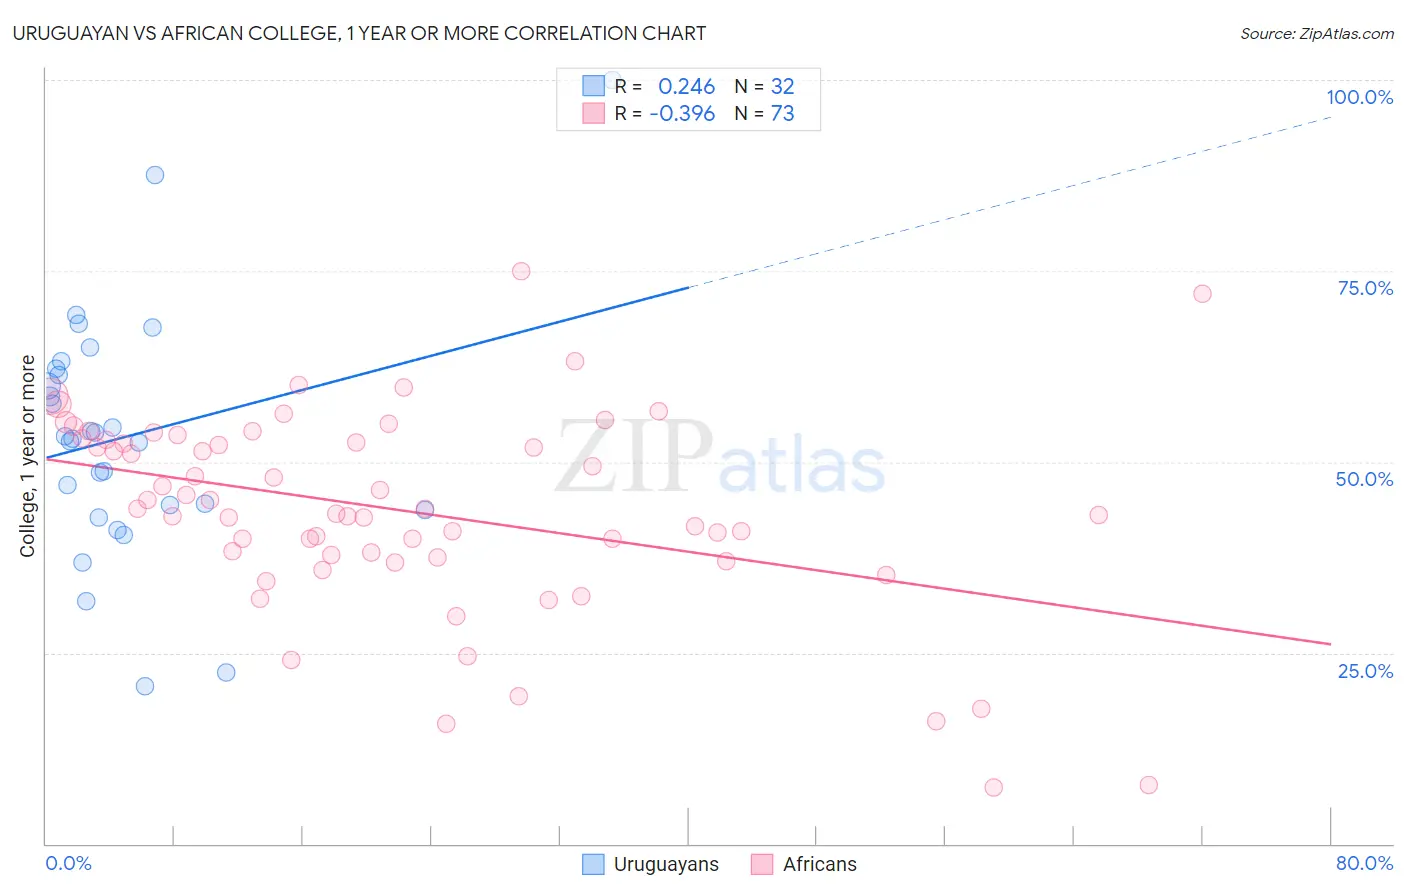
Uruguayan vs African College, 1 year or more Correlation Chart
The statistical analysis conducted on geographies consisting of 144,782,794 people shows a weak positive correlation between the proportion of Uruguayans and percentage of population with at least college, 1 year or more education in the United States with a correlation coefficient (R) of 0.246 and weighted average of 58.8%. Similarly, the statistical analysis conducted on geographies consisting of 470,090,594 people shows a mild negative correlation between the proportion of Africans and percentage of population with at least college, 1 year or more education in the United States with a correlation coefficient (R) of -0.396 and weighted average of 55.0%, a difference of 7.0%.
College, 1 year or more Correlation Summary
| Measurement | Uruguayan | African |
| Minimum | 20.6% | 7.4% |
| Maximum | 100.0% | 75.0% |
| Range | 79.4% | 67.6% |
| Mean | 53.3% | 43.7% |
| Median | 53.2% | 43.8% |
| Interquartile 25% (IQ1) | 44.0% | 37.7% |
| Interquartile 75% (IQ3) | 61.8% | 53.0% |
| Interquartile Range (IQR) | 17.8% | 15.3% |
| Standard Deviation (Sample) | 16.1% | 13.2% |
| Standard Deviation (Population) | 15.8% | 13.1% |
Similar Demographics by College, 1 year or more
Demographics Similar to Uruguayans by College, 1 year or more
In terms of college, 1 year or more, the demographic groups most similar to Uruguayans are Immigrants from Cameroon (58.8%, a difference of 0.040%), French (58.9%, a difference of 0.15%), German (58.9%, a difference of 0.17%), Immigrants from Philippines (58.7%, a difference of 0.17%), and Scotch-Irish (58.9%, a difference of 0.18%).
| Demographics | Rating | Rank | College, 1 year or more |
| Immigrants | Bosnia and Herzegovina | 42.8 /100 | #182 | Average 59.2% |
| German Russians | 39.3 /100 | #183 | Fair 59.1% |
| Spaniards | 38.3 /100 | #184 | Fair 59.0% |
| South Americans | 35.9 /100 | #185 | Fair 59.0% |
| Scotch-Irish | 34.7 /100 | #186 | Fair 58.9% |
| Germans | 34.7 /100 | #187 | Fair 58.9% |
| French | 34.4 /100 | #188 | Fair 58.9% |
| Uruguayans | 31.8 /100 | #189 | Fair 58.8% |
| Immigrants | Cameroon | 31.2 /100 | #190 | Fair 58.8% |
| Immigrants | Philippines | 29.2 /100 | #191 | Fair 58.7% |
| Colombians | 27.6 /100 | #192 | Fair 58.7% |
| Peruvians | 27.5 /100 | #193 | Fair 58.6% |
| Costa Ricans | 26.4 /100 | #194 | Fair 58.6% |
| Dutch | 26.2 /100 | #195 | Fair 58.6% |
| Guamanians/Chamorros | 26.2 /100 | #196 | Fair 58.6% |
Demographics Similar to Africans by College, 1 year or more
In terms of college, 1 year or more, the demographic groups most similar to Africans are Nepalese (54.9%, a difference of 0.060%), Jamaican (54.9%, a difference of 0.16%), Ottawa (54.9%, a difference of 0.19%), Immigrants from St. Vincent and the Grenadines (54.8%, a difference of 0.27%), and Indonesian (55.1%, a difference of 0.28%).
| Demographics | Rating | Rank | College, 1 year or more |
| Immigrants | Cambodia | 0.6 /100 | #251 | Tragic 55.4% |
| Aleuts | 0.6 /100 | #252 | Tragic 55.4% |
| Immigrants | Barbados | 0.6 /100 | #253 | Tragic 55.4% |
| Japanese | 0.5 /100 | #254 | Tragic 55.2% |
| Immigrants | Bahamas | 0.5 /100 | #255 | Tragic 55.2% |
| Immigrants | West Indies | 0.5 /100 | #256 | Tragic 55.2% |
| Indonesians | 0.4 /100 | #257 | Tragic 55.1% |
| Africans | 0.4 /100 | #258 | Tragic 55.0% |
| Nepalese | 0.3 /100 | #259 | Tragic 54.9% |
| Jamaicans | 0.3 /100 | #260 | Tragic 54.9% |
| Ottawa | 0.3 /100 | #261 | Tragic 54.9% |
| Immigrants | St. Vincent and the Grenadines | 0.3 /100 | #262 | Tragic 54.8% |
| U.S. Virgin Islanders | 0.3 /100 | #263 | Tragic 54.8% |
| Immigrants | Micronesia | 0.3 /100 | #264 | Tragic 54.8% |
| Immigrants | Laos | 0.2 /100 | #265 | Tragic 54.7% |