Pakistani vs Paiute Professional Degree
COMPARE
Pakistani
Paiute
Professional Degree
Professional Degree Comparison
Pakistanis
Paiute
4.8%
PROFESSIONAL DEGREE
90.9/ 100
METRIC RATING
132nd/ 347
METRIC RANK
3.4%
PROFESSIONAL DEGREE
0.3/ 100
METRIC RATING
294th/ 347
METRIC RANK
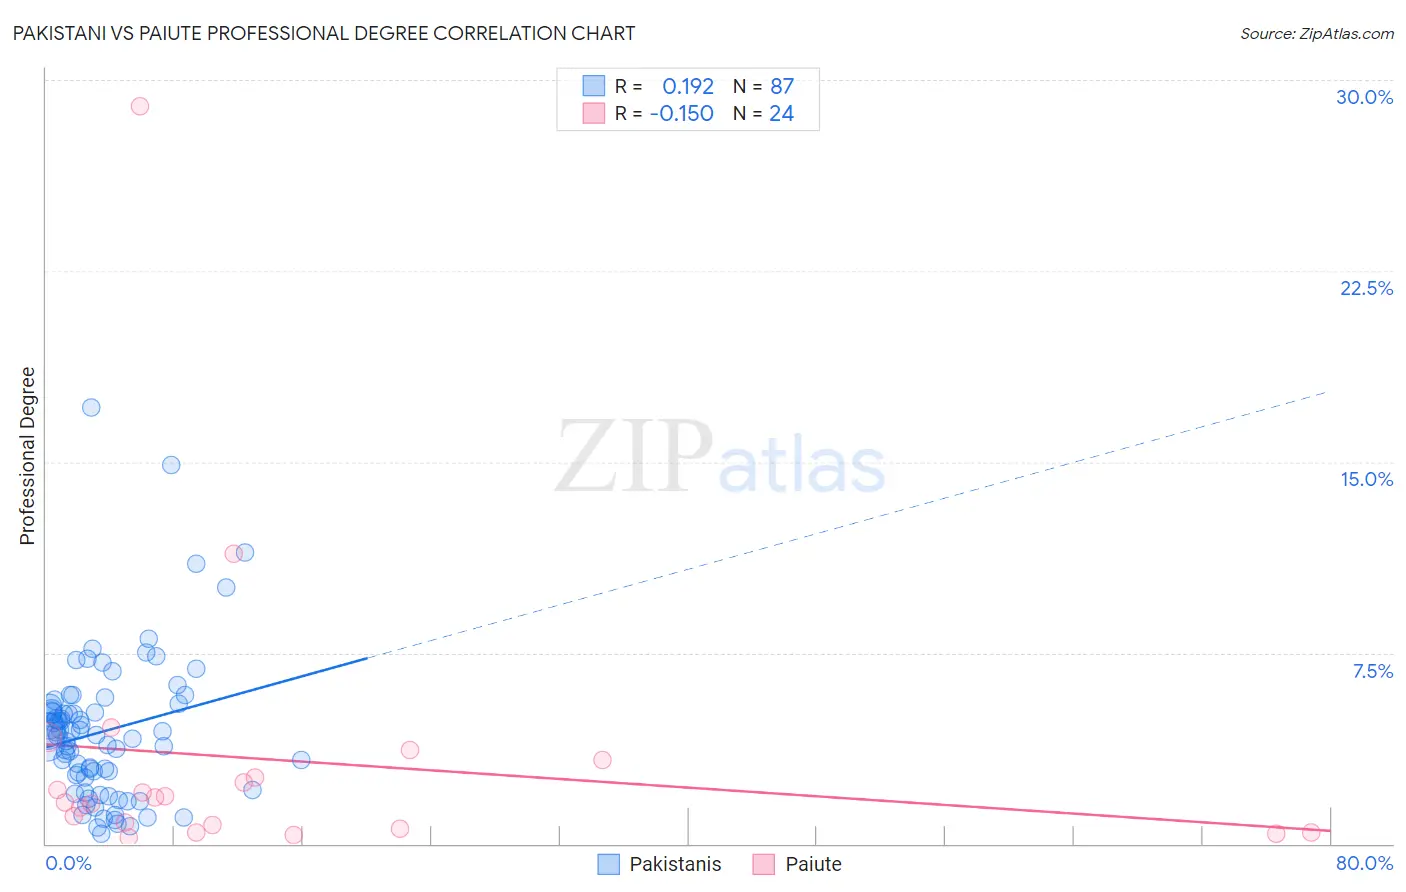
Pakistani vs Paiute Professional Degree Correlation Chart
The statistical analysis conducted on geographies consisting of 334,796,739 people shows a poor positive correlation between the proportion of Pakistanis and percentage of population with at least professional degree education in the United States with a correlation coefficient (R) of 0.192 and weighted average of 4.8%. Similarly, the statistical analysis conducted on geographies consisting of 58,323,381 people shows a poor negative correlation between the proportion of Paiute and percentage of population with at least professional degree education in the United States with a correlation coefficient (R) of -0.150 and weighted average of 3.4%, a difference of 38.4%.
Professional Degree Correlation Summary
| Measurement | Pakistani | Paiute |
| Minimum | 0.37% | 0.27% |
| Maximum | 17.1% | 29.0% |
| Range | 16.8% | 28.7% |
| Mean | 4.4% | 3.3% |
| Median | 4.3% | 1.7% |
| Interquartile 25% (IQ1) | 2.6% | 0.65% |
| Interquartile 75% (IQ3) | 5.4% | 2.9% |
| Interquartile Range (IQR) | 2.8% | 2.3% |
| Standard Deviation (Sample) | 2.9% | 5.9% |
| Standard Deviation (Population) | 2.9% | 5.8% |
Similar Demographics by Professional Degree
Demographics Similar to Pakistanis by Professional Degree
In terms of professional degree, the demographic groups most similar to Pakistanis are Immigrants from Nepal (4.8%, a difference of 0.22%), Icelander (4.8%, a difference of 0.25%), Italian (4.8%, a difference of 0.25%), Palestinian (4.8%, a difference of 0.27%), and South American Indian (4.8%, a difference of 0.38%).
| Demographics | Rating | Rank | Professional Degree |
| Immigrants | Albania | 93.3 /100 | #125 | Exceptional 4.8% |
| Europeans | 93.2 /100 | #126 | Exceptional 4.8% |
| Serbians | 92.6 /100 | #127 | Exceptional 4.8% |
| Immigrants | Eastern Africa | 92.5 /100 | #128 | Exceptional 4.8% |
| Palestinians | 91.5 /100 | #129 | Exceptional 4.8% |
| Icelanders | 91.5 /100 | #130 | Exceptional 4.8% |
| Immigrants | Nepal | 91.4 /100 | #131 | Exceptional 4.8% |
| Pakistanis | 90.9 /100 | #132 | Exceptional 4.8% |
| Italians | 90.2 /100 | #133 | Exceptional 4.8% |
| South American Indians | 89.9 /100 | #134 | Excellent 4.8% |
| Macedonians | 89.8 /100 | #135 | Excellent 4.8% |
| Immigrants | Jordan | 89.0 /100 | #136 | Excellent 4.7% |
| Jordanians | 88.9 /100 | #137 | Excellent 4.7% |
| Afghans | 88.8 /100 | #138 | Excellent 4.7% |
| South Americans | 85.6 /100 | #139 | Excellent 4.7% |
Demographics Similar to Paiute by Professional Degree
In terms of professional degree, the demographic groups most similar to Paiute are Immigrants from Honduras (3.5%, a difference of 0.080%), Immigrants from Guatemala (3.4%, a difference of 0.16%), Hawaiian (3.4%, a difference of 0.16%), Immigrants from Belize (3.5%, a difference of 0.32%), and Alaska Native (3.5%, a difference of 0.39%).
| Demographics | Rating | Rank | Professional Degree |
| Immigrants | El Salvador | 0.3 /100 | #287 | Tragic 3.5% |
| Blackfeet | 0.3 /100 | #288 | Tragic 3.5% |
| Guatemalans | 0.3 /100 | #289 | Tragic 3.5% |
| Chippewa | 0.3 /100 | #290 | Tragic 3.5% |
| Alaska Natives | 0.3 /100 | #291 | Tragic 3.5% |
| Immigrants | Belize | 0.3 /100 | #292 | Tragic 3.5% |
| Immigrants | Honduras | 0.3 /100 | #293 | Tragic 3.5% |
| Paiute | 0.3 /100 | #294 | Tragic 3.4% |
| Immigrants | Guatemala | 0.2 /100 | #295 | Tragic 3.4% |
| Hawaiians | 0.2 /100 | #296 | Tragic 3.4% |
| Immigrants | Liberia | 0.2 /100 | #297 | Tragic 3.4% |
| Ottawa | 0.2 /100 | #298 | Tragic 3.4% |
| Immigrants | Yemen | 0.2 /100 | #299 | Tragic 3.4% |
| Blacks/African Americans | 0.2 /100 | #300 | Tragic 3.4% |
| Immigrants | Dominican Republic | 0.2 /100 | #301 | Tragic 3.4% |