Immigrants from Asia vs Paiute Professional Degree
COMPARE
Immigrants from Asia
Paiute
Professional Degree
Professional Degree Comparison
Immigrants from Asia
Paiute
5.5%
PROFESSIONAL DEGREE
99.9/ 100
METRIC RATING
64th/ 347
METRIC RANK
3.4%
PROFESSIONAL DEGREE
0.3/ 100
METRIC RATING
294th/ 347
METRIC RANK
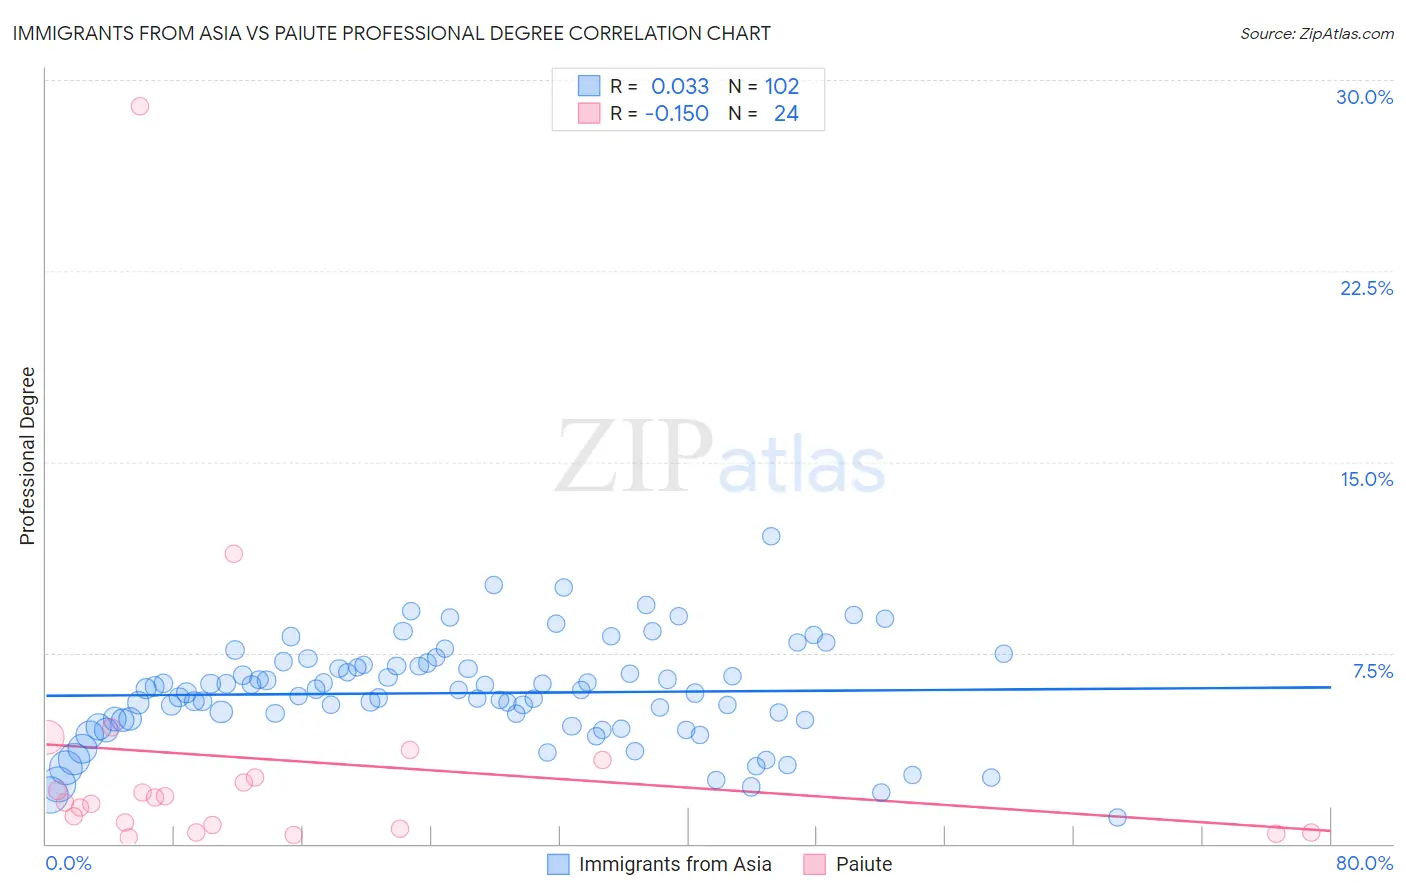
Immigrants from Asia vs Paiute Professional Degree Correlation Chart
The statistical analysis conducted on geographies consisting of 544,872,863 people shows no correlation between the proportion of Immigrants from Asia and percentage of population with at least professional degree education in the United States with a correlation coefficient (R) of 0.033 and weighted average of 5.5%. Similarly, the statistical analysis conducted on geographies consisting of 58,323,381 people shows a poor negative correlation between the proportion of Paiute and percentage of population with at least professional degree education in the United States with a correlation coefficient (R) of -0.150 and weighted average of 3.4%, a difference of 59.6%.
Professional Degree Correlation Summary
| Measurement | Immigrants from Asia | Paiute |
| Minimum | 1.1% | 0.27% |
| Maximum | 12.1% | 29.0% |
| Range | 11.0% | 28.7% |
| Mean | 5.9% | 3.3% |
| Median | 6.0% | 1.7% |
| Interquartile 25% (IQ1) | 4.9% | 0.65% |
| Interquartile 75% (IQ3) | 7.0% | 2.9% |
| Interquartile Range (IQR) | 2.1% | 2.3% |
| Standard Deviation (Sample) | 2.0% | 5.9% |
| Standard Deviation (Population) | 2.0% | 5.8% |
Similar Demographics by Professional Degree
Demographics Similar to Immigrants from Asia by Professional Degree
In terms of professional degree, the demographic groups most similar to Immigrants from Asia are Asian (5.5%, a difference of 0.060%), Immigrants from Bolivia (5.5%, a difference of 0.060%), Immigrants from Kazakhstan (5.5%, a difference of 0.30%), Immigrants from Belarus (5.5%, a difference of 0.49%), and Immigrants from Bulgaria (5.5%, a difference of 0.62%).
| Demographics | Rating | Rank | Professional Degree |
| South Africans | 100.0 /100 | #57 | Exceptional 5.7% |
| Bulgarians | 100.0 /100 | #58 | Exceptional 5.7% |
| Immigrants | Europe | 100.0 /100 | #59 | Exceptional 5.6% |
| Bolivians | 99.9 /100 | #60 | Exceptional 5.6% |
| Immigrants | Lithuania | 99.9 /100 | #61 | Exceptional 5.6% |
| Immigrants | Belarus | 99.9 /100 | #62 | Exceptional 5.5% |
| Asians | 99.9 /100 | #63 | Exceptional 5.5% |
| Immigrants | Asia | 99.9 /100 | #64 | Exceptional 5.5% |
| Immigrants | Bolivia | 99.9 /100 | #65 | Exceptional 5.5% |
| Immigrants | Kazakhstan | 99.9 /100 | #66 | Exceptional 5.5% |
| Immigrants | Bulgaria | 99.9 /100 | #67 | Exceptional 5.5% |
| Immigrants | Lebanon | 99.9 /100 | #68 | Exceptional 5.5% |
| Immigrants | Hungary | 99.9 /100 | #69 | Exceptional 5.5% |
| Bhutanese | 99.8 /100 | #70 | Exceptional 5.4% |
| Immigrants | Western Asia | 99.8 /100 | #71 | Exceptional 5.4% |
Demographics Similar to Paiute by Professional Degree
In terms of professional degree, the demographic groups most similar to Paiute are Immigrants from Honduras (3.5%, a difference of 0.080%), Immigrants from Guatemala (3.4%, a difference of 0.16%), Hawaiian (3.4%, a difference of 0.16%), Immigrants from Belize (3.5%, a difference of 0.32%), and Alaska Native (3.5%, a difference of 0.39%).
| Demographics | Rating | Rank | Professional Degree |
| Immigrants | El Salvador | 0.3 /100 | #287 | Tragic 3.5% |
| Blackfeet | 0.3 /100 | #288 | Tragic 3.5% |
| Guatemalans | 0.3 /100 | #289 | Tragic 3.5% |
| Chippewa | 0.3 /100 | #290 | Tragic 3.5% |
| Alaska Natives | 0.3 /100 | #291 | Tragic 3.5% |
| Immigrants | Belize | 0.3 /100 | #292 | Tragic 3.5% |
| Immigrants | Honduras | 0.3 /100 | #293 | Tragic 3.5% |
| Paiute | 0.3 /100 | #294 | Tragic 3.4% |
| Immigrants | Guatemala | 0.2 /100 | #295 | Tragic 3.4% |
| Hawaiians | 0.2 /100 | #296 | Tragic 3.4% |
| Immigrants | Liberia | 0.2 /100 | #297 | Tragic 3.4% |
| Ottawa | 0.2 /100 | #298 | Tragic 3.4% |
| Immigrants | Yemen | 0.2 /100 | #299 | Tragic 3.4% |
| Blacks/African Americans | 0.2 /100 | #300 | Tragic 3.4% |
| Immigrants | Dominican Republic | 0.2 /100 | #301 | Tragic 3.4% |