Ugandan vs Osage Professional Degree
COMPARE
Ugandan
Osage
Professional Degree
Professional Degree Comparison
Ugandans
Osage
5.1%
PROFESSIONAL DEGREE
98.8/ 100
METRIC RATING
100th/ 347
METRIC RANK
3.7%
PROFESSIONAL DEGREE
1.2/ 100
METRIC RATING
255th/ 347
METRIC RANK
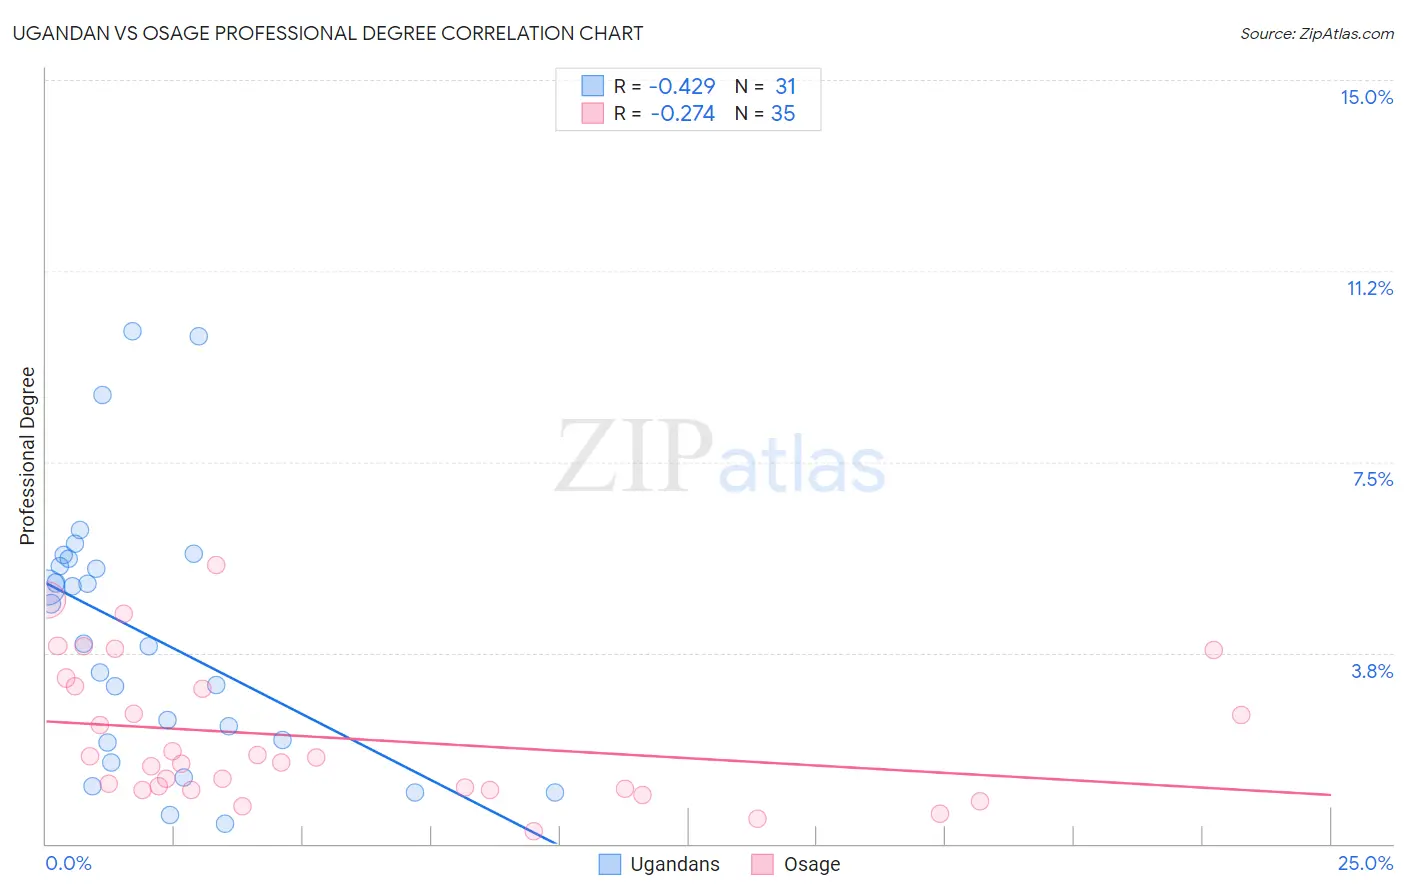
Ugandan vs Osage Professional Degree Correlation Chart
The statistical analysis conducted on geographies consisting of 93,981,800 people shows a moderate negative correlation between the proportion of Ugandans and percentage of population with at least professional degree education in the United States with a correlation coefficient (R) of -0.429 and weighted average of 5.1%. Similarly, the statistical analysis conducted on geographies consisting of 91,695,993 people shows a weak negative correlation between the proportion of Osage and percentage of population with at least professional degree education in the United States with a correlation coefficient (R) of -0.274 and weighted average of 3.7%, a difference of 38.3%.
Professional Degree Correlation Summary
| Measurement | Ugandan | Osage |
| Minimum | 0.38% | 0.26% |
| Maximum | 10.1% | 5.5% |
| Range | 9.7% | 5.2% |
| Mean | 4.1% | 2.1% |
| Median | 3.9% | 1.6% |
| Interquartile 25% (IQ1) | 2.0% | 1.1% |
| Interquartile 75% (IQ3) | 5.6% | 3.1% |
| Interquartile Range (IQR) | 3.6% | 2.0% |
| Standard Deviation (Sample) | 2.6% | 1.4% |
| Standard Deviation (Population) | 2.5% | 1.3% |
Similar Demographics by Professional Degree
Demographics Similar to Ugandans by Professional Degree
In terms of professional degree, the demographic groups most similar to Ugandans are Immigrants from Egypt (5.1%, a difference of 0.75%), Immigrants from Italy (5.2%, a difference of 0.76%), Austrian (5.2%, a difference of 0.82%), Ukrainian (5.1%, a difference of 0.83%), and Syrian (5.2%, a difference of 0.85%).
| Demographics | Rating | Rank | Professional Degree |
| Northern Europeans | 99.3 /100 | #93 | Exceptional 5.2% |
| Alsatians | 99.3 /100 | #94 | Exceptional 5.2% |
| Zimbabweans | 99.3 /100 | #95 | Exceptional 5.2% |
| Immigrants | Uzbekistan | 99.2 /100 | #96 | Exceptional 5.2% |
| Syrians | 99.1 /100 | #97 | Exceptional 5.2% |
| Austrians | 99.1 /100 | #98 | Exceptional 5.2% |
| Immigrants | Italy | 99.1 /100 | #99 | Exceptional 5.2% |
| Ugandans | 98.8 /100 | #100 | Exceptional 5.1% |
| Immigrants | Egypt | 98.5 /100 | #101 | Exceptional 5.1% |
| Ukrainians | 98.5 /100 | #102 | Exceptional 5.1% |
| Immigrants | Northern Africa | 98.4 /100 | #103 | Exceptional 5.1% |
| Arabs | 98.2 /100 | #104 | Exceptional 5.0% |
| Immigrants | Uganda | 98.2 /100 | #105 | Exceptional 5.0% |
| Immigrants | Ukraine | 98.2 /100 | #106 | Exceptional 5.0% |
| Maltese | 98.1 /100 | #107 | Exceptional 5.0% |
Demographics Similar to Osage by Professional Degree
In terms of professional degree, the demographic groups most similar to Osage are Iroquois (3.7%, a difference of 0.10%), Tongan (3.7%, a difference of 0.43%), Bahamian (3.7%, a difference of 0.47%), Immigrants from St. Vincent and the Grenadines (3.7%, a difference of 0.54%), and Pueblo (3.7%, a difference of 0.57%).
| Demographics | Rating | Rank | Professional Degree |
| Hmong | 1.6 /100 | #248 | Tragic 3.7% |
| Immigrants | Grenada | 1.5 /100 | #249 | Tragic 3.7% |
| Immigrants | Fiji | 1.5 /100 | #250 | Tragic 3.7% |
| Immigrants | Nicaragua | 1.4 /100 | #251 | Tragic 3.7% |
| Jamaicans | 1.4 /100 | #252 | Tragic 3.7% |
| Pueblo | 1.4 /100 | #253 | Tragic 3.7% |
| Tongans | 1.3 /100 | #254 | Tragic 3.7% |
| Osage | 1.2 /100 | #255 | Tragic 3.7% |
| Iroquois | 1.2 /100 | #256 | Tragic 3.7% |
| Bahamians | 1.1 /100 | #257 | Tragic 3.7% |
| Immigrants | St. Vincent and the Grenadines | 1.1 /100 | #258 | Tragic 3.7% |
| Africans | 1.0 /100 | #259 | Tragic 3.7% |
| Indonesians | 1.0 /100 | #260 | Tragic 3.7% |
| Immigrants | Guyana | 1.0 /100 | #261 | Tragic 3.7% |
| U.S. Virgin Islanders | 1.0 /100 | #262 | Tragic 3.7% |