Ugandan vs Chippewa 8th Grade
COMPARE
Ugandan
Chippewa
8th Grade
8th Grade Comparison
Ugandans
Chippewa
95.9%
8TH GRADE
74.1/ 100
METRIC RATING
156th/ 347
METRIC RANK
97.1%
8TH GRADE
100.0/ 100
METRIC RATING
31st/ 347
METRIC RANK
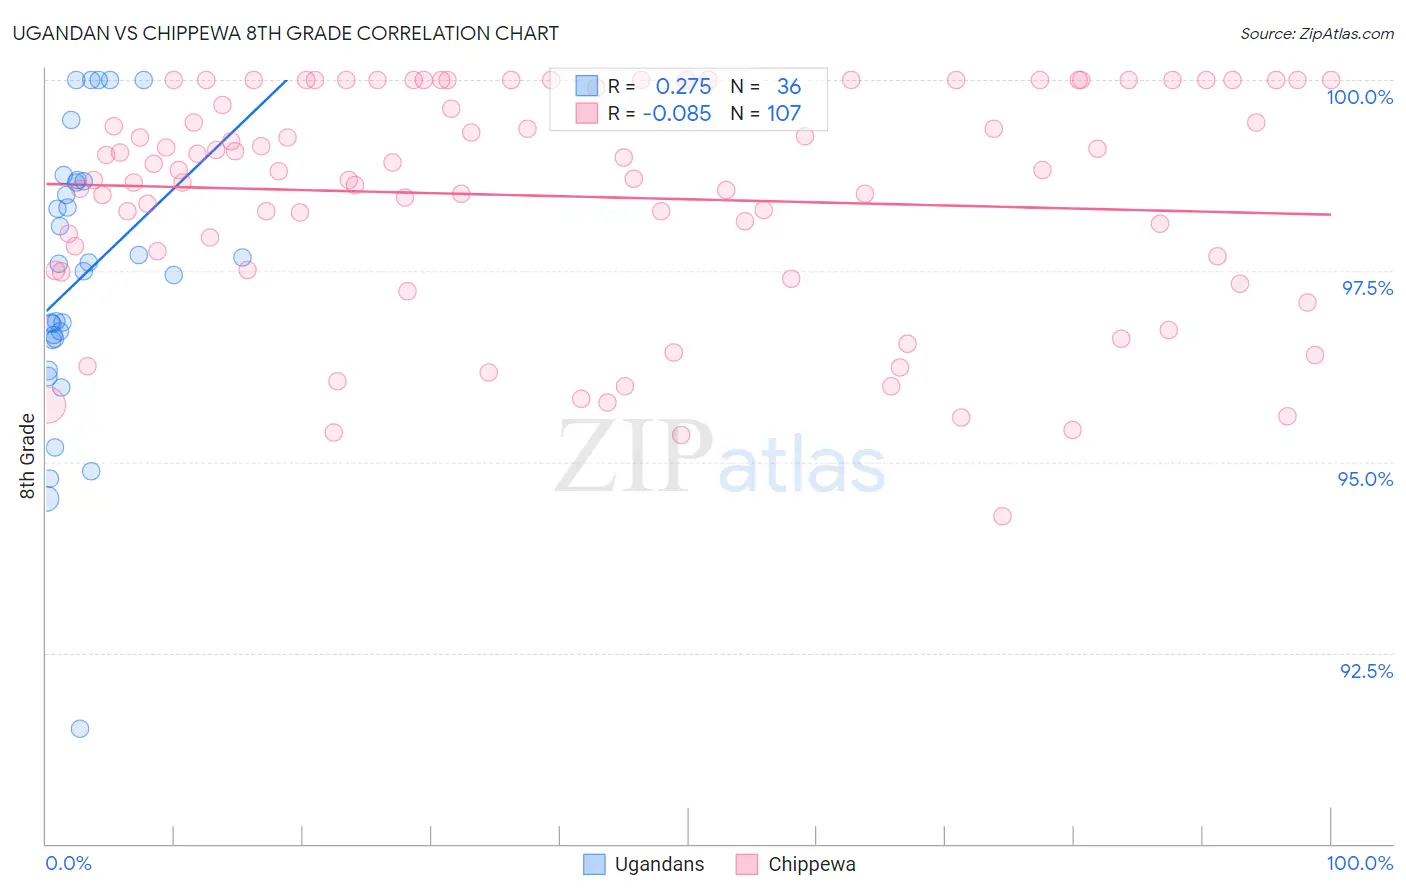
Ugandan vs Chippewa 8th Grade Correlation Chart
The statistical analysis conducted on geographies consisting of 93,991,892 people shows a weak positive correlation between the proportion of Ugandans and percentage of population with at least 8th grade education in the United States with a correlation coefficient (R) of 0.275 and weighted average of 95.9%. Similarly, the statistical analysis conducted on geographies consisting of 215,065,863 people shows a slight negative correlation between the proportion of Chippewa and percentage of population with at least 8th grade education in the United States with a correlation coefficient (R) of -0.085 and weighted average of 97.1%, a difference of 1.2%.
8th Grade Correlation Summary
| Measurement | Ugandan | Chippewa |
| Minimum | 91.5% | 94.3% |
| Maximum | 100.0% | 100.0% |
| Range | 8.5% | 5.7% |
| Mean | 97.4% | 98.5% |
| Median | 97.5% | 98.8% |
| Interquartile 25% (IQ1) | 96.6% | 97.5% |
| Interquartile 75% (IQ3) | 98.7% | 100.0% |
| Interquartile Range (IQR) | 2.1% | 2.5% |
| Standard Deviation (Sample) | 1.8% | 1.5% |
| Standard Deviation (Population) | 1.8% | 1.5% |
Similar Demographics by 8th Grade
Demographics Similar to Ugandans by 8th Grade
In terms of 8th grade, the demographic groups most similar to Ugandans are Kenyan (95.9%, a difference of 0.0%), Immigrants from Taiwan (95.9%, a difference of 0.030%), Arab (95.9%, a difference of 0.040%), Immigrants from Kazakhstan (95.9%, a difference of 0.040%), and Immigrants from Jordan (95.9%, a difference of 0.050%).
| Demographics | Rating | Rank | 8th Grade |
| Immigrants | Israel | 81.3 /100 | #149 | Excellent 96.0% |
| Immigrants | Russia | 80.9 /100 | #150 | Excellent 96.0% |
| Blackfeet | 80.8 /100 | #151 | Excellent 96.0% |
| French American Indians | 80.6 /100 | #152 | Excellent 96.0% |
| Immigrants | Jordan | 79.5 /100 | #153 | Good 95.9% |
| Hopi | 79.4 /100 | #154 | Good 95.9% |
| Kenyans | 74.5 /100 | #155 | Good 95.9% |
| Ugandans | 74.1 /100 | #156 | Good 95.9% |
| Immigrants | Taiwan | 70.5 /100 | #157 | Good 95.9% |
| Arabs | 69.4 /100 | #158 | Good 95.9% |
| Immigrants | Kazakhstan | 68.4 /100 | #159 | Good 95.9% |
| Seminole | 67.7 /100 | #160 | Good 95.8% |
| Bermudans | 67.5 /100 | #161 | Good 95.8% |
| Immigrants | Kenya | 67.2 /100 | #162 | Good 95.8% |
| Immigrants | Sri Lanka | 64.1 /100 | #163 | Good 95.8% |
Demographics Similar to Chippewa by 8th Grade
In terms of 8th grade, the demographic groups most similar to Chippewa are Sioux (97.1%, a difference of 0.0%), Italian (97.1%, a difference of 0.030%), European (97.1%, a difference of 0.030%), Yup'ik (97.0%, a difference of 0.030%), and Swiss (97.0%, a difference of 0.040%).
| Demographics | Rating | Rank | 8th Grade |
| Scandinavians | 100.0 /100 | #24 | Exceptional 97.2% |
| Czechs | 100.0 /100 | #25 | Exceptional 97.1% |
| French | 100.0 /100 | #26 | Exceptional 97.1% |
| Scotch-Irish | 100.0 /100 | #27 | Exceptional 97.1% |
| Italians | 100.0 /100 | #28 | Exceptional 97.1% |
| Europeans | 100.0 /100 | #29 | Exceptional 97.1% |
| Sioux | 100.0 /100 | #30 | Exceptional 97.1% |
| Chippewa | 100.0 /100 | #31 | Exceptional 97.1% |
| Yup'ik | 100.0 /100 | #32 | Exceptional 97.0% |
| Swiss | 100.0 /100 | #33 | Exceptional 97.0% |
| Luxembourgers | 100.0 /100 | #34 | Exceptional 97.0% |
| Alaska Natives | 100.0 /100 | #35 | Exceptional 97.0% |
| Belgians | 100.0 /100 | #36 | Exceptional 97.0% |
| Latvians | 100.0 /100 | #37 | Exceptional 97.0% |
| British | 100.0 /100 | #38 | Exceptional 97.0% |