Ugandan vs Cape Verdean 8th Grade
COMPARE
Ugandan
Cape Verdean
8th Grade
8th Grade Comparison
Ugandans
Cape Verdeans
95.9%
8TH GRADE
74.1/ 100
METRIC RATING
156th/ 347
METRIC RANK
93.5%
8TH GRADE
0.0/ 100
METRIC RATING
312th/ 347
METRIC RANK
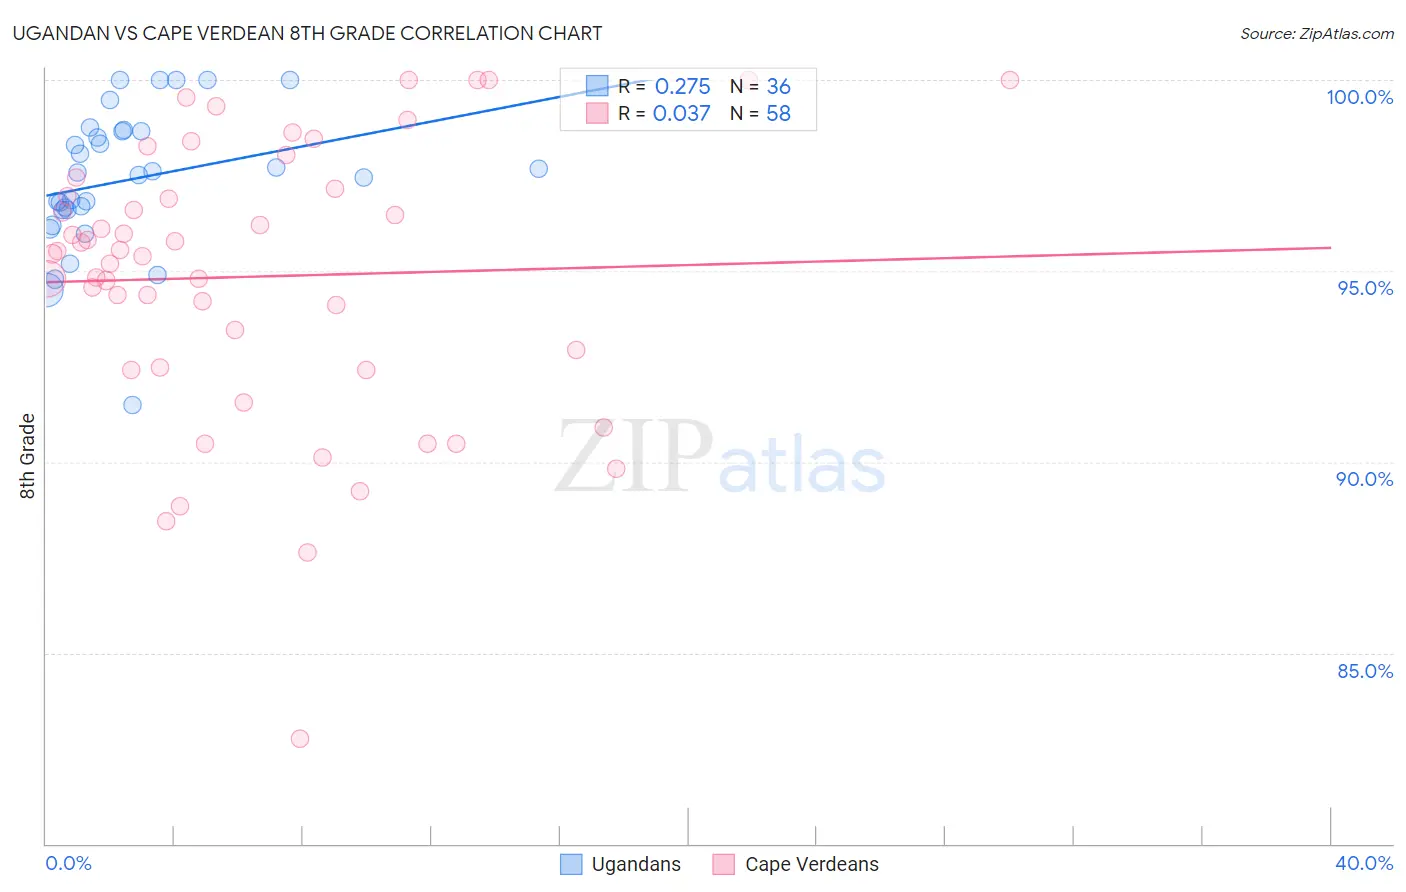
Ugandan vs Cape Verdean 8th Grade Correlation Chart
The statistical analysis conducted on geographies consisting of 93,991,892 people shows a weak positive correlation between the proportion of Ugandans and percentage of population with at least 8th grade education in the United States with a correlation coefficient (R) of 0.275 and weighted average of 95.9%. Similarly, the statistical analysis conducted on geographies consisting of 107,537,955 people shows no correlation between the proportion of Cape Verdeans and percentage of population with at least 8th grade education in the United States with a correlation coefficient (R) of 0.037 and weighted average of 93.5%, a difference of 2.5%.
8th Grade Correlation Summary
| Measurement | Ugandan | Cape Verdean |
| Minimum | 91.5% | 82.8% |
| Maximum | 100.0% | 100.0% |
| Range | 8.5% | 17.2% |
| Mean | 97.4% | 94.9% |
| Median | 97.5% | 95.5% |
| Interquartile 25% (IQ1) | 96.6% | 92.5% |
| Interquartile 75% (IQ3) | 98.7% | 97.2% |
| Interquartile Range (IQR) | 2.1% | 4.7% |
| Standard Deviation (Sample) | 1.8% | 3.6% |
| Standard Deviation (Population) | 1.8% | 3.6% |
Similar Demographics by 8th Grade
Demographics Similar to Ugandans by 8th Grade
In terms of 8th grade, the demographic groups most similar to Ugandans are Kenyan (95.9%, a difference of 0.0%), Immigrants from Taiwan (95.9%, a difference of 0.030%), Arab (95.9%, a difference of 0.040%), Immigrants from Kazakhstan (95.9%, a difference of 0.040%), and Immigrants from Jordan (95.9%, a difference of 0.050%).
| Demographics | Rating | Rank | 8th Grade |
| Immigrants | Israel | 81.3 /100 | #149 | Excellent 96.0% |
| Immigrants | Russia | 80.9 /100 | #150 | Excellent 96.0% |
| Blackfeet | 80.8 /100 | #151 | Excellent 96.0% |
| French American Indians | 80.6 /100 | #152 | Excellent 96.0% |
| Immigrants | Jordan | 79.5 /100 | #153 | Good 95.9% |
| Hopi | 79.4 /100 | #154 | Good 95.9% |
| Kenyans | 74.5 /100 | #155 | Good 95.9% |
| Ugandans | 74.1 /100 | #156 | Good 95.9% |
| Immigrants | Taiwan | 70.5 /100 | #157 | Good 95.9% |
| Arabs | 69.4 /100 | #158 | Good 95.9% |
| Immigrants | Kazakhstan | 68.4 /100 | #159 | Good 95.9% |
| Seminole | 67.7 /100 | #160 | Good 95.8% |
| Bermudans | 67.5 /100 | #161 | Good 95.8% |
| Immigrants | Kenya | 67.2 /100 | #162 | Good 95.8% |
| Immigrants | Sri Lanka | 64.1 /100 | #163 | Good 95.8% |
Demographics Similar to Cape Verdeans by 8th Grade
In terms of 8th grade, the demographic groups most similar to Cape Verdeans are Immigrants from Caribbean (93.5%, a difference of 0.030%), Japanese (93.6%, a difference of 0.040%), Immigrants from Bangladesh (93.6%, a difference of 0.040%), Immigrants from Vietnam (93.5%, a difference of 0.040%), and Immigrants (93.6%, a difference of 0.050%).
| Demographics | Rating | Rank | 8th Grade |
| Immigrants | Haiti | 0.0 /100 | #305 | Tragic 93.9% |
| Immigrants | Guyana | 0.0 /100 | #306 | Tragic 93.8% |
| Immigrants | Portugal | 0.0 /100 | #307 | Tragic 93.8% |
| Ecuadorians | 0.0 /100 | #308 | Tragic 93.6% |
| Immigrants | Immigrants | 0.0 /100 | #309 | Tragic 93.6% |
| Japanese | 0.0 /100 | #310 | Tragic 93.6% |
| Immigrants | Bangladesh | 0.0 /100 | #311 | Tragic 93.6% |
| Cape Verdeans | 0.0 /100 | #312 | Tragic 93.5% |
| Immigrants | Caribbean | 0.0 /100 | #313 | Tragic 93.5% |
| Immigrants | Vietnam | 0.0 /100 | #314 | Tragic 93.5% |
| Vietnamese | 0.0 /100 | #315 | Tragic 93.5% |
| Immigrants | Cambodia | 0.0 /100 | #316 | Tragic 93.3% |
| Immigrants | Ecuador | 0.0 /100 | #317 | Tragic 93.3% |
| Puerto Ricans | 0.0 /100 | #318 | Tragic 93.2% |
| Immigrants | Cuba | 0.0 /100 | #319 | Tragic 93.2% |