Ugandan vs Taiwanese 8th Grade
COMPARE
Ugandan
Taiwanese
8th Grade
8th Grade Comparison
Ugandans
Taiwanese
95.9%
8TH GRADE
74.1/ 100
METRIC RATING
156th/ 347
METRIC RANK
94.7%
8TH GRADE
0.1/ 100
METRIC RATING
277th/ 347
METRIC RANK
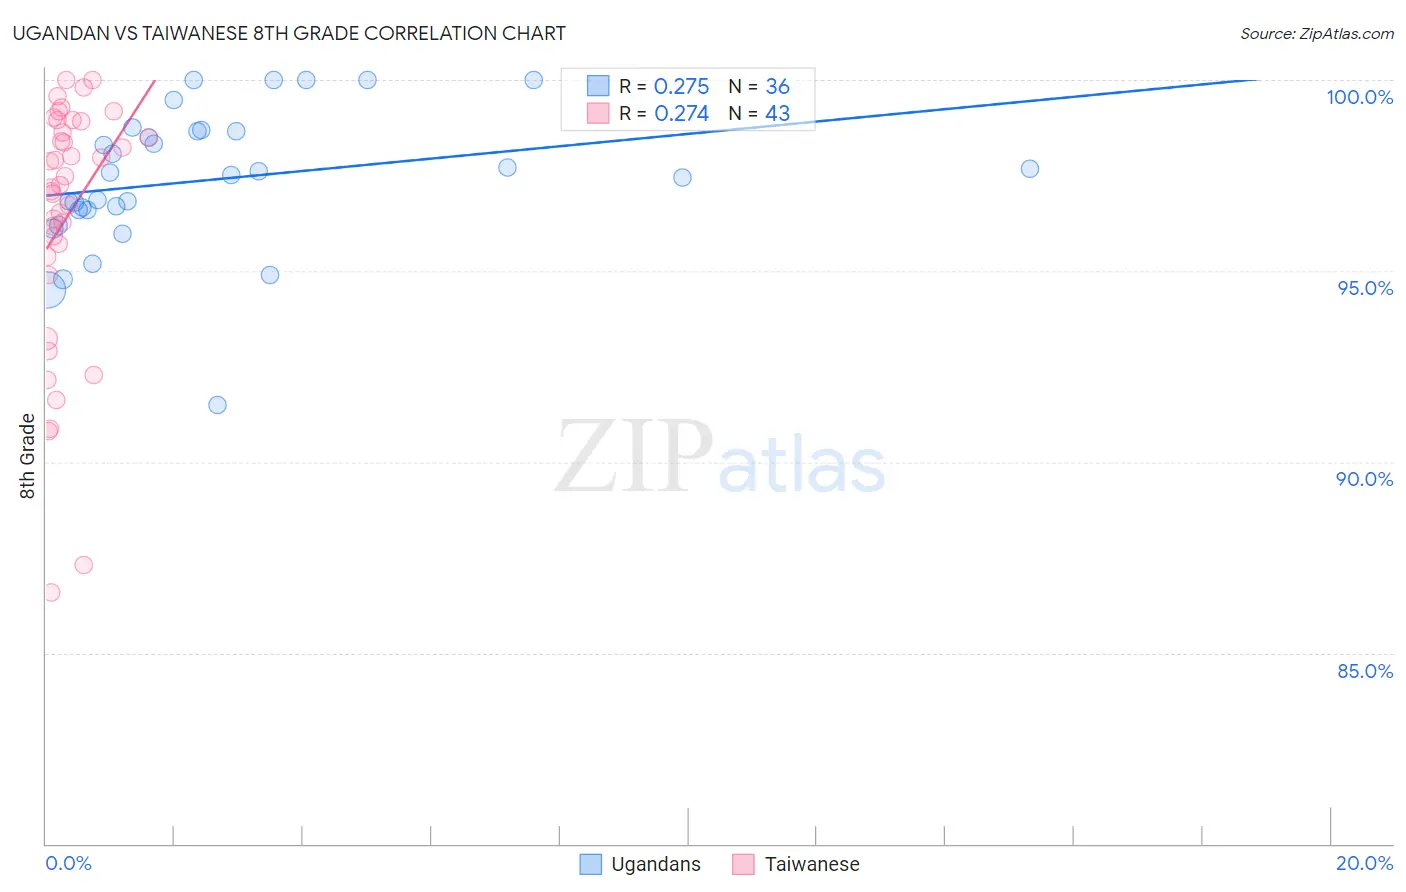
Ugandan vs Taiwanese 8th Grade Correlation Chart
The statistical analysis conducted on geographies consisting of 93,991,892 people shows a weak positive correlation between the proportion of Ugandans and percentage of population with at least 8th grade education in the United States with a correlation coefficient (R) of 0.275 and weighted average of 95.9%. Similarly, the statistical analysis conducted on geographies consisting of 31,677,387 people shows a weak positive correlation between the proportion of Taiwanese and percentage of population with at least 8th grade education in the United States with a correlation coefficient (R) of 0.274 and weighted average of 94.7%, a difference of 1.3%.
8th Grade Correlation Summary
| Measurement | Ugandan | Taiwanese |
| Minimum | 91.5% | 86.6% |
| Maximum | 100.0% | 100.0% |
| Range | 8.5% | 13.4% |
| Mean | 97.4% | 96.4% |
| Median | 97.5% | 97.3% |
| Interquartile 25% (IQ1) | 96.6% | 95.4% |
| Interquartile 75% (IQ3) | 98.7% | 98.9% |
| Interquartile Range (IQR) | 2.1% | 3.5% |
| Standard Deviation (Sample) | 1.8% | 3.3% |
| Standard Deviation (Population) | 1.8% | 3.3% |
Similar Demographics by 8th Grade
Demographics Similar to Ugandans by 8th Grade
In terms of 8th grade, the demographic groups most similar to Ugandans are Kenyan (95.9%, a difference of 0.0%), Immigrants from Taiwan (95.9%, a difference of 0.030%), Arab (95.9%, a difference of 0.040%), Immigrants from Kazakhstan (95.9%, a difference of 0.040%), and Immigrants from Jordan (95.9%, a difference of 0.050%).
| Demographics | Rating | Rank | 8th Grade |
| Immigrants | Israel | 81.3 /100 | #149 | Excellent 96.0% |
| Immigrants | Russia | 80.9 /100 | #150 | Excellent 96.0% |
| Blackfeet | 80.8 /100 | #151 | Excellent 96.0% |
| French American Indians | 80.6 /100 | #152 | Excellent 96.0% |
| Immigrants | Jordan | 79.5 /100 | #153 | Good 95.9% |
| Hopi | 79.4 /100 | #154 | Good 95.9% |
| Kenyans | 74.5 /100 | #155 | Good 95.9% |
| Ugandans | 74.1 /100 | #156 | Good 95.9% |
| Immigrants | Taiwan | 70.5 /100 | #157 | Good 95.9% |
| Arabs | 69.4 /100 | #158 | Good 95.9% |
| Immigrants | Kazakhstan | 68.4 /100 | #159 | Good 95.9% |
| Seminole | 67.7 /100 | #160 | Good 95.8% |
| Bermudans | 67.5 /100 | #161 | Good 95.8% |
| Immigrants | Kenya | 67.2 /100 | #162 | Good 95.8% |
| Immigrants | Sri Lanka | 64.1 /100 | #163 | Good 95.8% |
Demographics Similar to Taiwanese by 8th Grade
In terms of 8th grade, the demographic groups most similar to Taiwanese are Peruvian (94.7%, a difference of 0.030%), Armenian (94.7%, a difference of 0.030%), Immigrants from Trinidad and Tobago (94.6%, a difference of 0.040%), Barbadian (94.6%, a difference of 0.040%), and Immigrants from Bolivia (94.6%, a difference of 0.040%).
| Demographics | Rating | Rank | 8th Grade |
| Immigrants | Uzbekistan | 0.2 /100 | #270 | Tragic 94.8% |
| Immigrants | Afghanistan | 0.2 /100 | #271 | Tragic 94.8% |
| Immigrants | South America | 0.2 /100 | #272 | Tragic 94.8% |
| Immigrants | Western Africa | 0.2 /100 | #273 | Tragic 94.8% |
| Trinidadians and Tobagonians | 0.2 /100 | #274 | Tragic 94.7% |
| Immigrants | Colombia | 0.2 /100 | #275 | Tragic 94.7% |
| Peruvians | 0.1 /100 | #276 | Tragic 94.7% |
| Taiwanese | 0.1 /100 | #277 | Tragic 94.7% |
| Armenians | 0.1 /100 | #278 | Tragic 94.7% |
| Immigrants | Trinidad and Tobago | 0.1 /100 | #279 | Tragic 94.6% |
| Barbadians | 0.1 /100 | #280 | Tragic 94.6% |
| Immigrants | Bolivia | 0.1 /100 | #281 | Tragic 94.6% |
| Immigrants | Eritrea | 0.1 /100 | #282 | Tragic 94.6% |
| Immigrants | St. Vincent and the Grenadines | 0.1 /100 | #283 | Tragic 94.6% |
| Immigrants | Philippines | 0.1 /100 | #284 | Tragic 94.6% |