Immigrants from Afghanistan vs Colombian High School Diploma
COMPARE
Immigrants from Afghanistan
Colombian
High School Diploma
High School Diploma Comparison
Immigrants from Afghanistan
Colombians
88.3%
HIGH SCHOOL DIPLOMA
8.6/ 100
METRIC RATING
221st/ 347
METRIC RANK
88.1%
HIGH SCHOOL DIPLOMA
3.8/ 100
METRIC RATING
231st/ 347
METRIC RANK
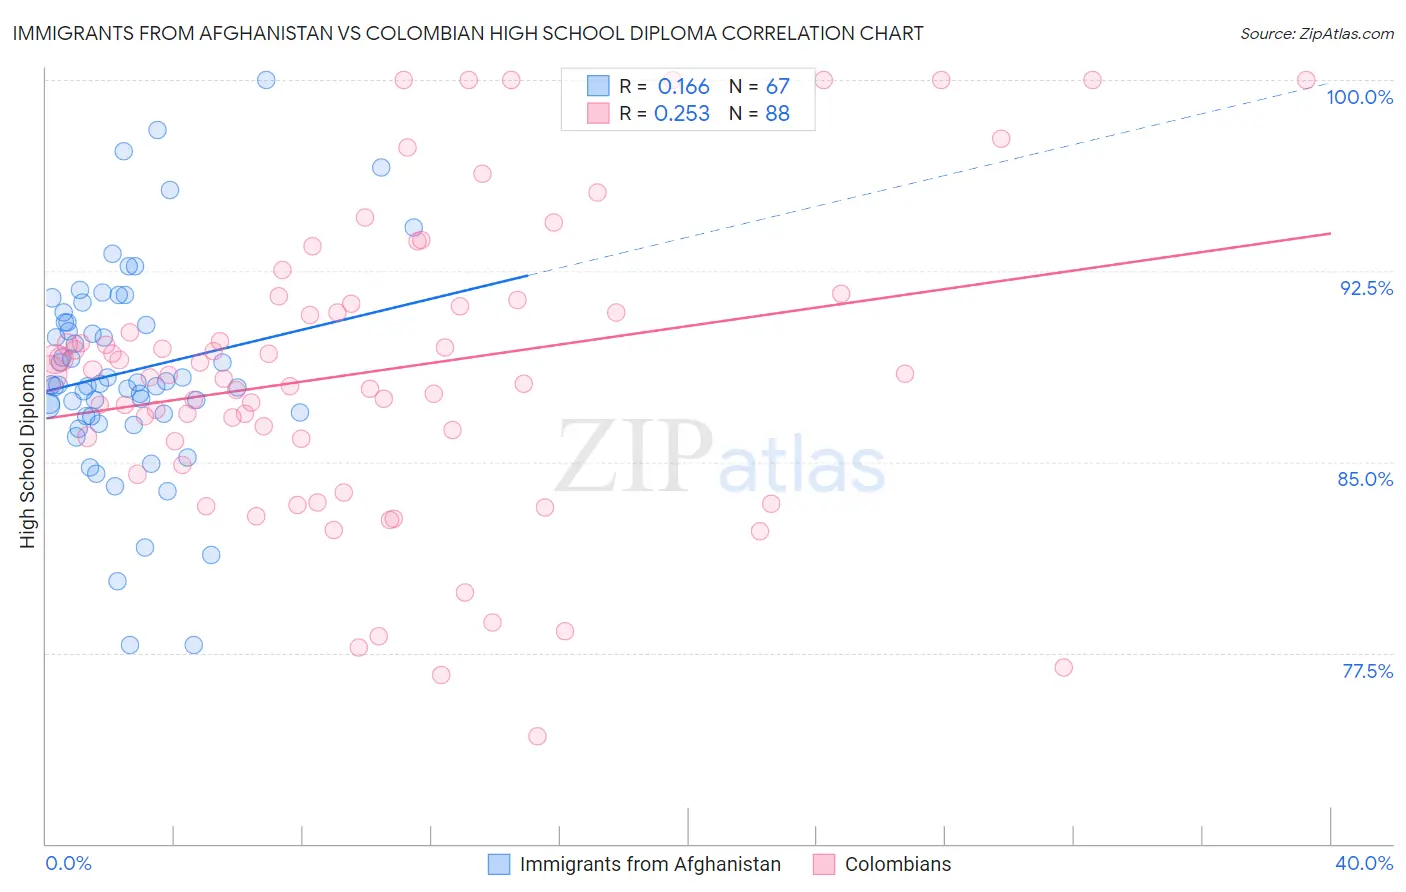
Immigrants from Afghanistan vs Colombian High School Diploma Correlation Chart
The statistical analysis conducted on geographies consisting of 147,629,579 people shows a poor positive correlation between the proportion of Immigrants from Afghanistan and percentage of population with at least high school diploma education in the United States with a correlation coefficient (R) of 0.166 and weighted average of 88.3%. Similarly, the statistical analysis conducted on geographies consisting of 419,701,311 people shows a weak positive correlation between the proportion of Colombians and percentage of population with at least high school diploma education in the United States with a correlation coefficient (R) of 0.253 and weighted average of 88.1%, a difference of 0.33%.
High School Diploma Correlation Summary
| Measurement | Immigrants from Afghanistan | Colombian |
| Minimum | 77.8% | 74.2% |
| Maximum | 100.0% | 100.0% |
| Range | 22.2% | 25.8% |
| Mean | 88.5% | 88.6% |
| Median | 88.0% | 88.4% |
| Interquartile 25% (IQ1) | 86.8% | 85.9% |
| Interquartile 75% (IQ3) | 90.5% | 91.2% |
| Interquartile Range (IQR) | 3.7% | 5.3% |
| Standard Deviation (Sample) | 4.1% | 5.8% |
| Standard Deviation (Population) | 4.1% | 5.8% |
Demographics Similar to Immigrants from Afghanistan and Colombians by High School Diploma
In terms of high school diploma, the demographic groups most similar to Immigrants from Afghanistan are Tongan (88.4%, a difference of 0.040%), Colville (88.3%, a difference of 0.040%), Costa Rican (88.4%, a difference of 0.050%), Immigrants from Zaire (88.3%, a difference of 0.050%), and Immigrants from Bolivia (88.4%, a difference of 0.070%). Similarly, the demographic groups most similar to Colombians are Blackfeet (88.1%, a difference of 0.040%), Immigrants from Middle Africa (88.0%, a difference of 0.050%), Immigrants from Panama (88.0%, a difference of 0.080%), Immigrants from Thailand (88.0%, a difference of 0.090%), and Immigrants from Bahamas (88.0%, a difference of 0.10%).
| Demographics | Rating | Rank | High School Diploma |
| Chickasaw | 10.7 /100 | #216 | Poor 88.4% |
| Immigrants | Africa | 10.6 /100 | #217 | Poor 88.4% |
| Immigrants | Bolivia | 10.3 /100 | #218 | Poor 88.4% |
| Costa Ricans | 9.6 /100 | #219 | Tragic 88.4% |
| Tongans | 9.5 /100 | #220 | Tragic 88.4% |
| Immigrants | Afghanistan | 8.6 /100 | #221 | Tragic 88.3% |
| Colville | 7.8 /100 | #222 | Tragic 88.3% |
| Immigrants | Zaire | 7.6 /100 | #223 | Tragic 88.3% |
| Shoshone | 7.0 /100 | #224 | Tragic 88.3% |
| Creek | 6.9 /100 | #225 | Tragic 88.3% |
| Uruguayans | 5.6 /100 | #226 | Tragic 88.2% |
| Immigrants | Liberia | 5.5 /100 | #227 | Tragic 88.2% |
| Kiowa | 5.3 /100 | #228 | Tragic 88.2% |
| Nigerians | 5.2 /100 | #229 | Tragic 88.2% |
| Blackfeet | 4.2 /100 | #230 | Tragic 88.1% |
| Colombians | 3.8 /100 | #231 | Tragic 88.1% |
| Immigrants | Middle Africa | 3.4 /100 | #232 | Tragic 88.0% |
| Immigrants | Panama | 3.1 /100 | #233 | Tragic 88.0% |
| Immigrants | Thailand | 3.1 /100 | #234 | Tragic 88.0% |
| Immigrants | Bahamas | 2.9 /100 | #235 | Tragic 88.0% |
| Sub-Saharan Africans | 2.8 /100 | #236 | Tragic 87.9% |