Bermudan vs Colombian High School Diploma
COMPARE
Bermudan
Colombian
High School Diploma
High School Diploma Comparison
Bermudans
Colombians
89.3%
HIGH SCHOOL DIPLOMA
61.1/ 100
METRIC RATING
162nd/ 347
METRIC RANK
88.1%
HIGH SCHOOL DIPLOMA
3.8/ 100
METRIC RATING
231st/ 347
METRIC RANK
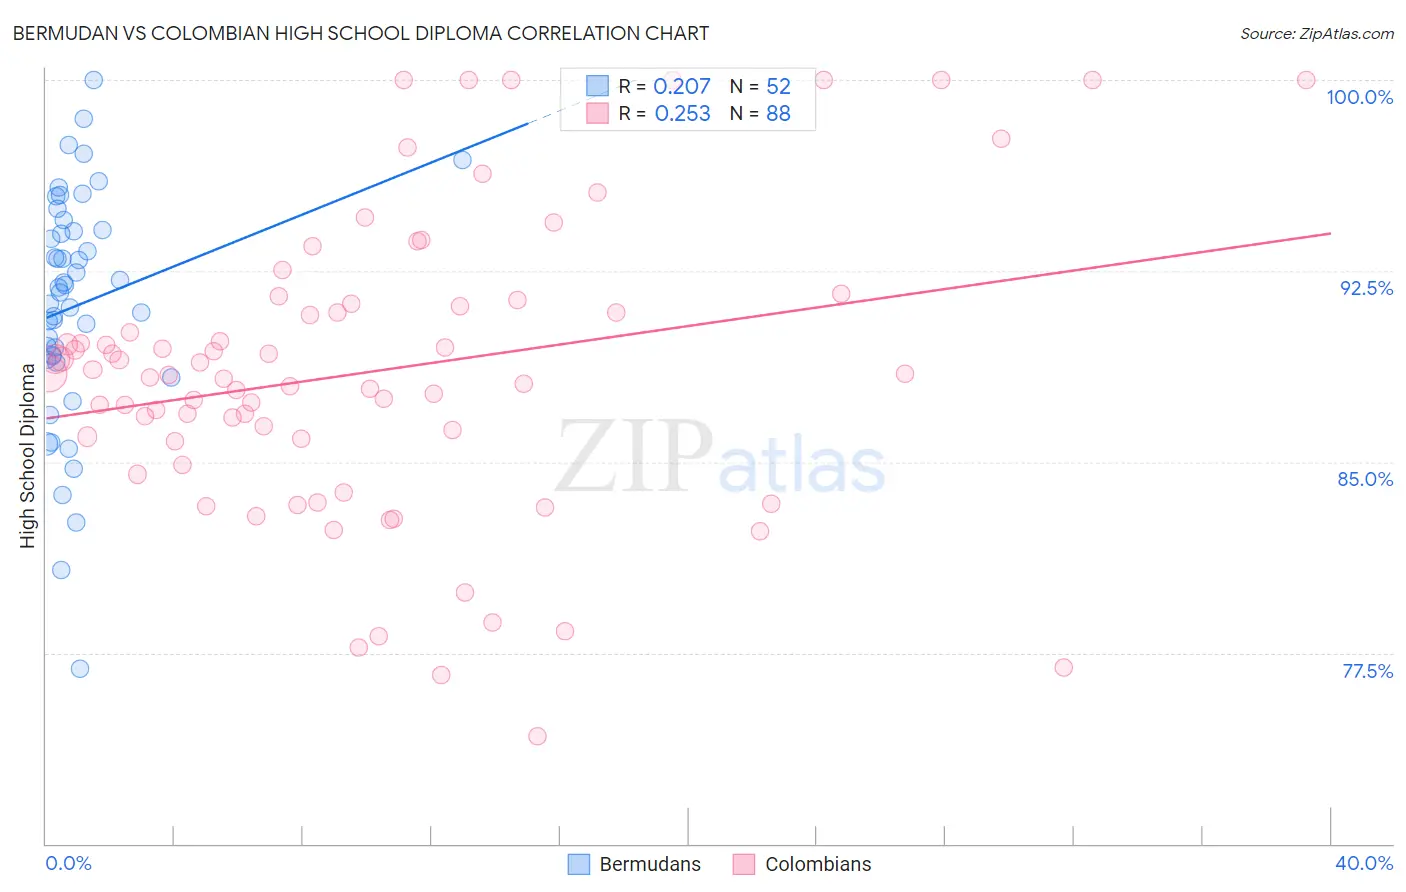
Bermudan vs Colombian High School Diploma Correlation Chart
The statistical analysis conducted on geographies consisting of 55,730,379 people shows a weak positive correlation between the proportion of Bermudans and percentage of population with at least high school diploma education in the United States with a correlation coefficient (R) of 0.207 and weighted average of 89.3%. Similarly, the statistical analysis conducted on geographies consisting of 419,701,311 people shows a weak positive correlation between the proportion of Colombians and percentage of population with at least high school diploma education in the United States with a correlation coefficient (R) of 0.253 and weighted average of 88.1%, a difference of 1.4%.
High School Diploma Correlation Summary
| Measurement | Bermudan | Colombian |
| Minimum | 76.9% | 74.2% |
| Maximum | 100.0% | 100.0% |
| Range | 23.1% | 25.8% |
| Mean | 91.1% | 88.6% |
| Median | 91.7% | 88.4% |
| Interquartile 25% (IQ1) | 89.1% | 85.9% |
| Interquartile 75% (IQ3) | 94.1% | 91.2% |
| Interquartile Range (IQR) | 5.0% | 5.3% |
| Standard Deviation (Sample) | 4.6% | 5.8% |
| Standard Deviation (Population) | 4.5% | 5.8% |
Similar Demographics by High School Diploma
Demographics Similar to Bermudans by High School Diploma
In terms of high school diploma, the demographic groups most similar to Bermudans are Brazilian (89.3%, a difference of 0.0%), Cree (89.3%, a difference of 0.0%), Immigrants from Nepal (89.3%, a difference of 0.0%), Immigrants from China (89.3%, a difference of 0.010%), and Laotian (89.3%, a difference of 0.010%).
| Demographics | Rating | Rank | High School Diploma |
| Immigrants | Northern Africa | 66.4 /100 | #155 | Good 89.4% |
| Immigrants | Argentina | 65.5 /100 | #156 | Good 89.4% |
| Immigrants | Malaysia | 63.5 /100 | #157 | Good 89.3% |
| Immigrants | Pakistan | 62.5 /100 | #158 | Good 89.3% |
| Immigrants | China | 62.0 /100 | #159 | Good 89.3% |
| Laotians | 61.8 /100 | #160 | Good 89.3% |
| Brazilians | 61.2 /100 | #161 | Good 89.3% |
| Bermudans | 61.1 /100 | #162 | Good 89.3% |
| Cree | 61.1 /100 | #163 | Good 89.3% |
| Immigrants | Nepal | 61.1 /100 | #164 | Good 89.3% |
| Immigrants | Asia | 59.8 /100 | #165 | Average 89.3% |
| Immigrants | Albania | 59.4 /100 | #166 | Average 89.3% |
| Immigrants | Hong Kong | 58.6 /100 | #167 | Average 89.3% |
| Delaware | 55.8 /100 | #168 | Average 89.2% |
| Iroquois | 55.1 /100 | #169 | Average 89.2% |
Demographics Similar to Colombians by High School Diploma
In terms of high school diploma, the demographic groups most similar to Colombians are Blackfeet (88.1%, a difference of 0.040%), Immigrants from Middle Africa (88.0%, a difference of 0.050%), Immigrants from Panama (88.0%, a difference of 0.080%), Immigrants from Thailand (88.0%, a difference of 0.090%), and Immigrants from Bahamas (88.0%, a difference of 0.10%).
| Demographics | Rating | Rank | High School Diploma |
| Shoshone | 7.0 /100 | #224 | Tragic 88.3% |
| Creek | 6.9 /100 | #225 | Tragic 88.3% |
| Uruguayans | 5.6 /100 | #226 | Tragic 88.2% |
| Immigrants | Liberia | 5.5 /100 | #227 | Tragic 88.2% |
| Kiowa | 5.3 /100 | #228 | Tragic 88.2% |
| Nigerians | 5.2 /100 | #229 | Tragic 88.2% |
| Blackfeet | 4.2 /100 | #230 | Tragic 88.1% |
| Colombians | 3.8 /100 | #231 | Tragic 88.1% |
| Immigrants | Middle Africa | 3.4 /100 | #232 | Tragic 88.0% |
| Immigrants | Panama | 3.1 /100 | #233 | Tragic 88.0% |
| Immigrants | Thailand | 3.1 /100 | #234 | Tragic 88.0% |
| Immigrants | Bahamas | 2.9 /100 | #235 | Tragic 88.0% |
| Sub-Saharan Africans | 2.8 /100 | #236 | Tragic 87.9% |
| Taiwanese | 2.8 /100 | #237 | Tragic 87.9% |
| Sioux | 2.7 /100 | #238 | Tragic 87.9% |