Turkish vs Immigrants from Panama 7th Grade
COMPARE
Turkish
Immigrants from Panama
7th Grade
7th Grade Comparison
Turks
Immigrants from Panama
96.7%
7TH GRADE
99.1/ 100
METRIC RATING
86th/ 347
METRIC RANK
95.6%
7TH GRADE
4.9/ 100
METRIC RATING
229th/ 347
METRIC RANK
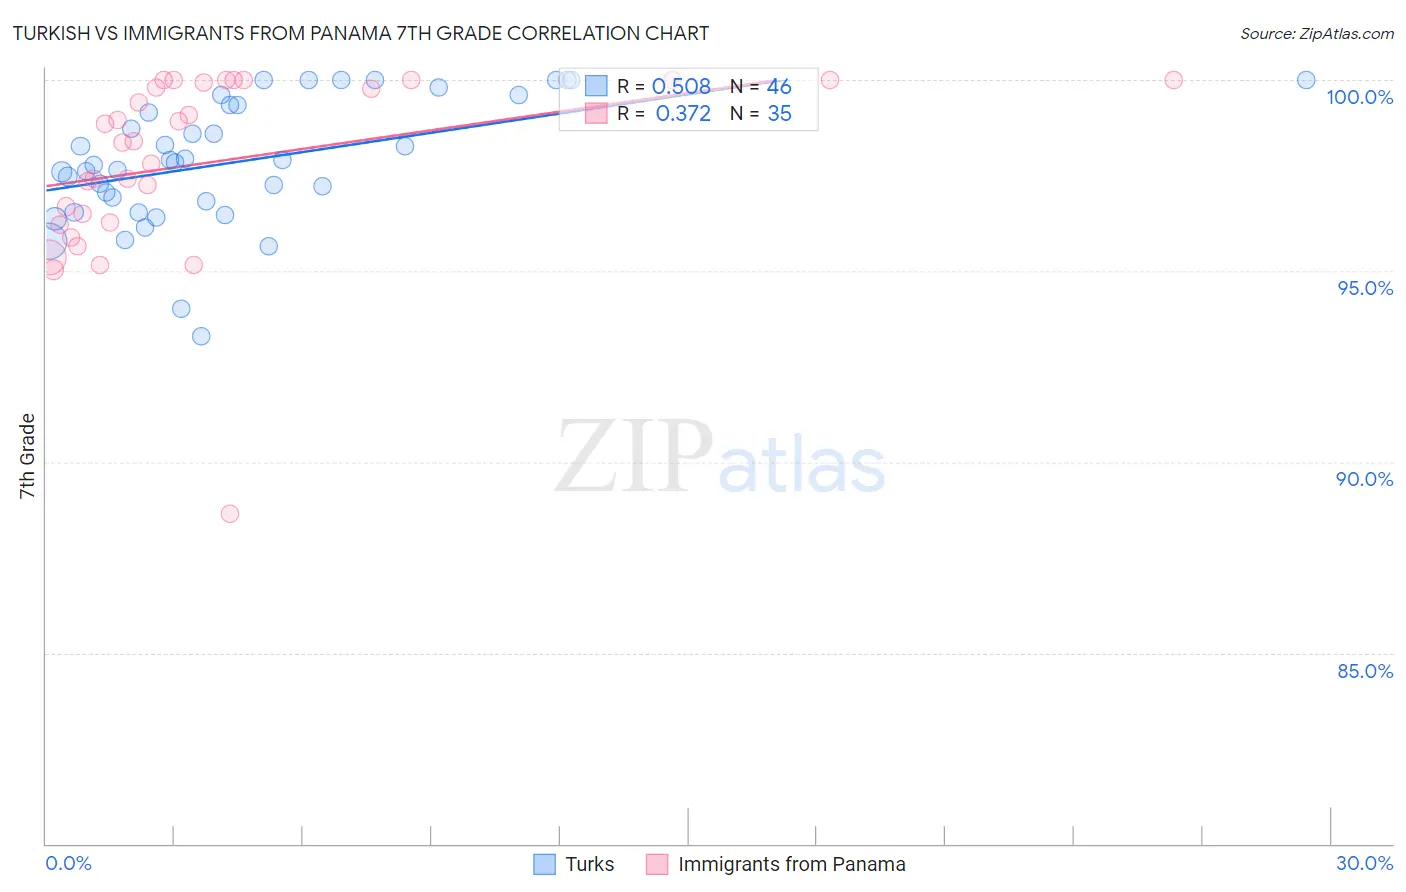
Turkish vs Immigrants from Panama 7th Grade Correlation Chart
The statistical analysis conducted on geographies consisting of 271,858,657 people shows a substantial positive correlation between the proportion of Turks and percentage of population with at least 7th grade education in the United States with a correlation coefficient (R) of 0.508 and weighted average of 96.7%. Similarly, the statistical analysis conducted on geographies consisting of 221,182,871 people shows a mild positive correlation between the proportion of Immigrants from Panama and percentage of population with at least 7th grade education in the United States with a correlation coefficient (R) of 0.372 and weighted average of 95.6%, a difference of 1.2%.
7th Grade Correlation Summary
| Measurement | Turkish | Immigrants from Panama |
| Minimum | 93.3% | 88.7% |
| Maximum | 100.0% | 100.0% |
| Range | 6.7% | 11.3% |
| Mean | 97.9% | 97.9% |
| Median | 97.9% | 98.4% |
| Interquartile 25% (IQ1) | 96.8% | 96.3% |
| Interquartile 75% (IQ3) | 99.4% | 100.0% |
| Interquartile Range (IQR) | 2.5% | 3.7% |
| Standard Deviation (Sample) | 1.6% | 2.4% |
| Standard Deviation (Population) | 1.6% | 2.3% |
Similar Demographics by 7th Grade
Demographics Similar to Turks by 7th Grade
In terms of 7th grade, the demographic groups most similar to Turks are Icelander (96.7%, a difference of 0.010%), Romanian (96.7%, a difference of 0.010%), Kiowa (96.7%, a difference of 0.010%), Immigrants from Belgium (96.7%, a difference of 0.010%), and Puget Sound Salish (96.7%, a difference of 0.010%).
| Demographics | Rating | Rank | 7th Grade |
| Cypriots | 99.3 /100 | #79 | Exceptional 96.8% |
| Yugoslavians | 99.3 /100 | #80 | Exceptional 96.8% |
| Delaware | 99.2 /100 | #81 | Exceptional 96.8% |
| Chickasaw | 99.2 /100 | #82 | Exceptional 96.7% |
| Icelanders | 99.1 /100 | #83 | Exceptional 96.7% |
| Romanians | 99.1 /100 | #84 | Exceptional 96.7% |
| Kiowa | 99.1 /100 | #85 | Exceptional 96.7% |
| Turks | 99.1 /100 | #86 | Exceptional 96.7% |
| Immigrants | Belgium | 99.0 /100 | #87 | Exceptional 96.7% |
| Puget Sound Salish | 99.0 /100 | #88 | Exceptional 96.7% |
| Cree | 99.0 /100 | #89 | Exceptional 96.7% |
| Immigrants | South Africa | 98.9 /100 | #90 | Exceptional 96.7% |
| Osage | 98.9 /100 | #91 | Exceptional 96.7% |
| Immigrants | Western Europe | 98.9 /100 | #92 | Exceptional 96.7% |
| Potawatomi | 98.9 /100 | #93 | Exceptional 96.7% |
Demographics Similar to Immigrants from Panama by 7th Grade
In terms of 7th grade, the demographic groups most similar to Immigrants from Panama are Immigrants from Western Asia (95.6%, a difference of 0.010%), Immigrants from Eastern Africa (95.6%, a difference of 0.010%), Native/Alaskan (95.6%, a difference of 0.020%), Immigrants from Eastern Asia (95.6%, a difference of 0.030%), and Senegalese (95.6%, a difference of 0.030%).
| Demographics | Rating | Rank | 7th Grade |
| Laotians | 6.8 /100 | #222 | Tragic 95.7% |
| Immigrants | Syria | 6.7 /100 | #223 | Tragic 95.7% |
| Immigrants | Oceania | 6.7 /100 | #224 | Tragic 95.7% |
| Immigrants | Malaysia | 6.2 /100 | #225 | Tragic 95.6% |
| Immigrants | Eastern Asia | 5.8 /100 | #226 | Tragic 95.6% |
| Immigrants | Western Asia | 5.4 /100 | #227 | Tragic 95.6% |
| Immigrants | Eastern Africa | 5.1 /100 | #228 | Tragic 95.6% |
| Immigrants | Panama | 4.9 /100 | #229 | Tragic 95.6% |
| Natives/Alaskans | 4.2 /100 | #230 | Tragic 95.6% |
| Senegalese | 4.0 /100 | #231 | Tragic 95.6% |
| Costa Ricans | 3.3 /100 | #232 | Tragic 95.5% |
| Immigrants | Indonesia | 3.3 /100 | #233 | Tragic 95.5% |
| Nigerians | 3.0 /100 | #234 | Tragic 95.5% |
| Immigrants | Africa | 2.7 /100 | #235 | Tragic 95.5% |
| Asians | 2.6 /100 | #236 | Tragic 95.5% |