Turkish vs British West Indian 7th Grade
COMPARE
Turkish
British West Indian
7th Grade
7th Grade Comparison
Turks
British West Indians
96.7%
7TH GRADE
99.1/ 100
METRIC RATING
86th/ 347
METRIC RANK
94.8%
7TH GRADE
0.0/ 100
METRIC RATING
288th/ 347
METRIC RANK
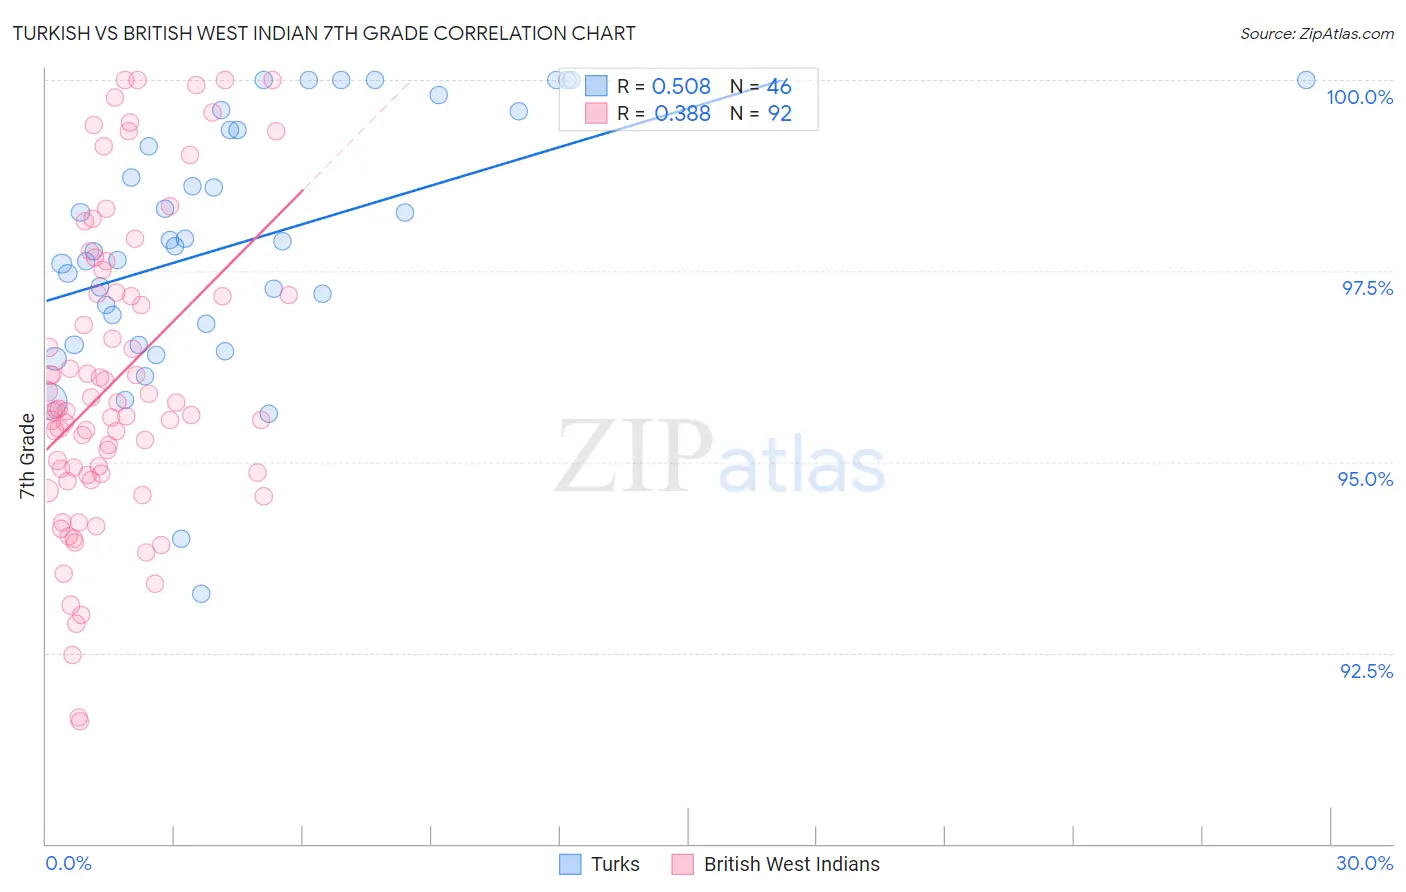
Turkish vs British West Indian 7th Grade Correlation Chart
The statistical analysis conducted on geographies consisting of 271,858,657 people shows a substantial positive correlation between the proportion of Turks and percentage of population with at least 7th grade education in the United States with a correlation coefficient (R) of 0.508 and weighted average of 96.7%. Similarly, the statistical analysis conducted on geographies consisting of 152,691,173 people shows a mild positive correlation between the proportion of British West Indians and percentage of population with at least 7th grade education in the United States with a correlation coefficient (R) of 0.388 and weighted average of 94.8%, a difference of 2.0%.
7th Grade Correlation Summary
| Measurement | Turkish | British West Indian |
| Minimum | 93.3% | 91.6% |
| Maximum | 100.0% | 100.0% |
| Range | 6.7% | 8.4% |
| Mean | 97.9% | 96.1% |
| Median | 97.9% | 95.7% |
| Interquartile 25% (IQ1) | 96.8% | 94.8% |
| Interquartile 75% (IQ3) | 99.4% | 97.2% |
| Interquartile Range (IQR) | 2.5% | 2.4% |
| Standard Deviation (Sample) | 1.6% | 2.0% |
| Standard Deviation (Population) | 1.6% | 2.0% |
Similar Demographics by 7th Grade
Demographics Similar to Turks by 7th Grade
In terms of 7th grade, the demographic groups most similar to Turks are Icelander (96.7%, a difference of 0.010%), Romanian (96.7%, a difference of 0.010%), Kiowa (96.7%, a difference of 0.010%), Immigrants from Belgium (96.7%, a difference of 0.010%), and Puget Sound Salish (96.7%, a difference of 0.010%).
| Demographics | Rating | Rank | 7th Grade |
| Cypriots | 99.3 /100 | #79 | Exceptional 96.8% |
| Yugoslavians | 99.3 /100 | #80 | Exceptional 96.8% |
| Delaware | 99.2 /100 | #81 | Exceptional 96.8% |
| Chickasaw | 99.2 /100 | #82 | Exceptional 96.7% |
| Icelanders | 99.1 /100 | #83 | Exceptional 96.7% |
| Romanians | 99.1 /100 | #84 | Exceptional 96.7% |
| Kiowa | 99.1 /100 | #85 | Exceptional 96.7% |
| Turks | 99.1 /100 | #86 | Exceptional 96.7% |
| Immigrants | Belgium | 99.0 /100 | #87 | Exceptional 96.7% |
| Puget Sound Salish | 99.0 /100 | #88 | Exceptional 96.7% |
| Cree | 99.0 /100 | #89 | Exceptional 96.7% |
| Immigrants | South Africa | 98.9 /100 | #90 | Exceptional 96.7% |
| Osage | 98.9 /100 | #91 | Exceptional 96.7% |
| Immigrants | Western Europe | 98.9 /100 | #92 | Exceptional 96.7% |
| Potawatomi | 98.9 /100 | #93 | Exceptional 96.7% |
Demographics Similar to British West Indians by 7th Grade
In terms of 7th grade, the demographic groups most similar to British West Indians are Taiwanese (94.8%, a difference of 0.010%), Immigrants from Peru (94.9%, a difference of 0.020%), Immigrants from Philippines (94.9%, a difference of 0.030%), Malaysian (94.8%, a difference of 0.030%), and Immigrants from Grenada (94.8%, a difference of 0.070%).
| Demographics | Rating | Rank | 7th Grade |
| Tohono O'odham | 0.1 /100 | #281 | Tragic 95.0% |
| Immigrants | Bolivia | 0.1 /100 | #282 | Tragic 95.0% |
| Immigrants | Barbados | 0.1 /100 | #283 | Tragic 95.0% |
| Armenians | 0.1 /100 | #284 | Tragic 95.0% |
| Immigrants | Eritrea | 0.1 /100 | #285 | Tragic 94.9% |
| Immigrants | Philippines | 0.0 /100 | #286 | Tragic 94.9% |
| Immigrants | Peru | 0.0 /100 | #287 | Tragic 94.9% |
| British West Indians | 0.0 /100 | #288 | Tragic 94.8% |
| Taiwanese | 0.0 /100 | #289 | Tragic 94.8% |
| Malaysians | 0.0 /100 | #290 | Tragic 94.8% |
| Immigrants | Grenada | 0.0 /100 | #291 | Tragic 94.8% |
| Immigrants | West Indies | 0.0 /100 | #292 | Tragic 94.8% |
| Fijians | 0.0 /100 | #293 | Tragic 94.7% |
| Haitians | 0.0 /100 | #294 | Tragic 94.7% |
| Yaqui | 0.0 /100 | #295 | Tragic 94.6% |