Turkish vs Immigrants from Canada 7th Grade
COMPARE
Turkish
Immigrants from Canada
7th Grade
7th Grade Comparison
Turks
Immigrants from Canada
96.7%
7TH GRADE
99.1/ 100
METRIC RATING
86th/ 347
METRIC RANK
96.9%
7TH GRADE
99.8/ 100
METRIC RATING
60th/ 347
METRIC RANK
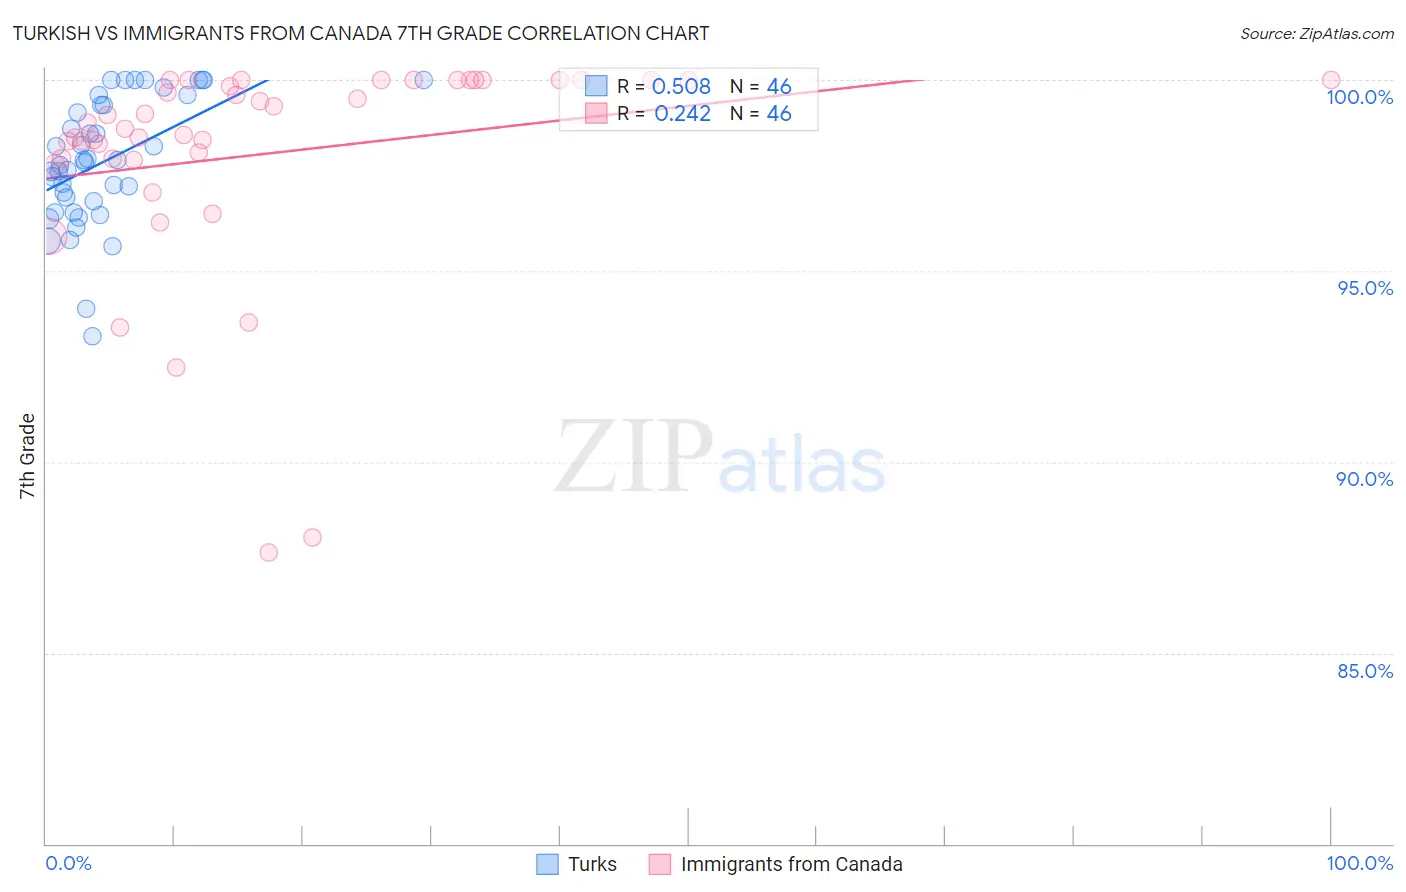
Turkish vs Immigrants from Canada 7th Grade Correlation Chart
The statistical analysis conducted on geographies consisting of 271,858,657 people shows a substantial positive correlation between the proportion of Turks and percentage of population with at least 7th grade education in the United States with a correlation coefficient (R) of 0.508 and weighted average of 96.7%. Similarly, the statistical analysis conducted on geographies consisting of 459,397,484 people shows a weak positive correlation between the proportion of Immigrants from Canada and percentage of population with at least 7th grade education in the United States with a correlation coefficient (R) of 0.242 and weighted average of 96.9%, a difference of 0.23%.
7th Grade Correlation Summary
| Measurement | Turkish | Immigrants from Canada |
| Minimum | 93.3% | 87.6% |
| Maximum | 100.0% | 100.0% |
| Range | 6.7% | 12.4% |
| Mean | 97.9% | 98.1% |
| Median | 97.9% | 98.8% |
| Interquartile 25% (IQ1) | 96.8% | 97.9% |
| Interquartile 75% (IQ3) | 99.4% | 100.0% |
| Interquartile Range (IQR) | 2.5% | 2.1% |
| Standard Deviation (Sample) | 1.6% | 2.8% |
| Standard Deviation (Population) | 1.6% | 2.8% |
Similar Demographics by 7th Grade
Demographics Similar to Turks by 7th Grade
In terms of 7th grade, the demographic groups most similar to Turks are Icelander (96.7%, a difference of 0.010%), Romanian (96.7%, a difference of 0.010%), Kiowa (96.7%, a difference of 0.010%), Immigrants from Belgium (96.7%, a difference of 0.010%), and Puget Sound Salish (96.7%, a difference of 0.010%).
| Demographics | Rating | Rank | 7th Grade |
| Cypriots | 99.3 /100 | #79 | Exceptional 96.8% |
| Yugoslavians | 99.3 /100 | #80 | Exceptional 96.8% |
| Delaware | 99.2 /100 | #81 | Exceptional 96.8% |
| Chickasaw | 99.2 /100 | #82 | Exceptional 96.7% |
| Icelanders | 99.1 /100 | #83 | Exceptional 96.7% |
| Romanians | 99.1 /100 | #84 | Exceptional 96.7% |
| Kiowa | 99.1 /100 | #85 | Exceptional 96.7% |
| Turks | 99.1 /100 | #86 | Exceptional 96.7% |
| Immigrants | Belgium | 99.0 /100 | #87 | Exceptional 96.7% |
| Puget Sound Salish | 99.0 /100 | #88 | Exceptional 96.7% |
| Cree | 99.0 /100 | #89 | Exceptional 96.7% |
| Immigrants | South Africa | 98.9 /100 | #90 | Exceptional 96.7% |
| Osage | 98.9 /100 | #91 | Exceptional 96.7% |
| Immigrants | Western Europe | 98.9 /100 | #92 | Exceptional 96.7% |
| Potawatomi | 98.9 /100 | #93 | Exceptional 96.7% |
Demographics Similar to Immigrants from Canada by 7th Grade
In terms of 7th grade, the demographic groups most similar to Immigrants from Canada are Creek (96.9%, a difference of 0.0%), White/Caucasian (97.0%, a difference of 0.010%), Macedonian (97.0%, a difference of 0.010%), Immigrants from North America (96.9%, a difference of 0.010%), and American (97.0%, a difference of 0.020%).
| Demographics | Rating | Rank | 7th Grade |
| Austrians | 99.8 /100 | #53 | Exceptional 97.0% |
| Australians | 99.8 /100 | #54 | Exceptional 97.0% |
| Russians | 99.8 /100 | #55 | Exceptional 97.0% |
| Serbians | 99.8 /100 | #56 | Exceptional 97.0% |
| Americans | 99.8 /100 | #57 | Exceptional 97.0% |
| Whites/Caucasians | 99.8 /100 | #58 | Exceptional 97.0% |
| Macedonians | 99.8 /100 | #59 | Exceptional 97.0% |
| Immigrants | Canada | 99.8 /100 | #60 | Exceptional 96.9% |
| Creek | 99.8 /100 | #61 | Exceptional 96.9% |
| Immigrants | North America | 99.8 /100 | #62 | Exceptional 96.9% |
| Immigrants | Northern Europe | 99.7 /100 | #63 | Exceptional 96.9% |
| Immigrants | Austria | 99.7 /100 | #64 | Exceptional 96.9% |
| Canadians | 99.7 /100 | #65 | Exceptional 96.9% |
| Ukrainians | 99.7 /100 | #66 | Exceptional 96.9% |
| Native Hawaiians | 99.7 /100 | #67 | Exceptional 96.9% |