Native/Alaskan vs British West Indian 7th Grade
COMPARE
Native/Alaskan
British West Indian
7th Grade
7th Grade Comparison
Natives/Alaskans
British West Indians
95.6%
7TH GRADE
4.2/ 100
METRIC RATING
230th/ 347
METRIC RANK
94.8%
7TH GRADE
0.0/ 100
METRIC RATING
288th/ 347
METRIC RANK
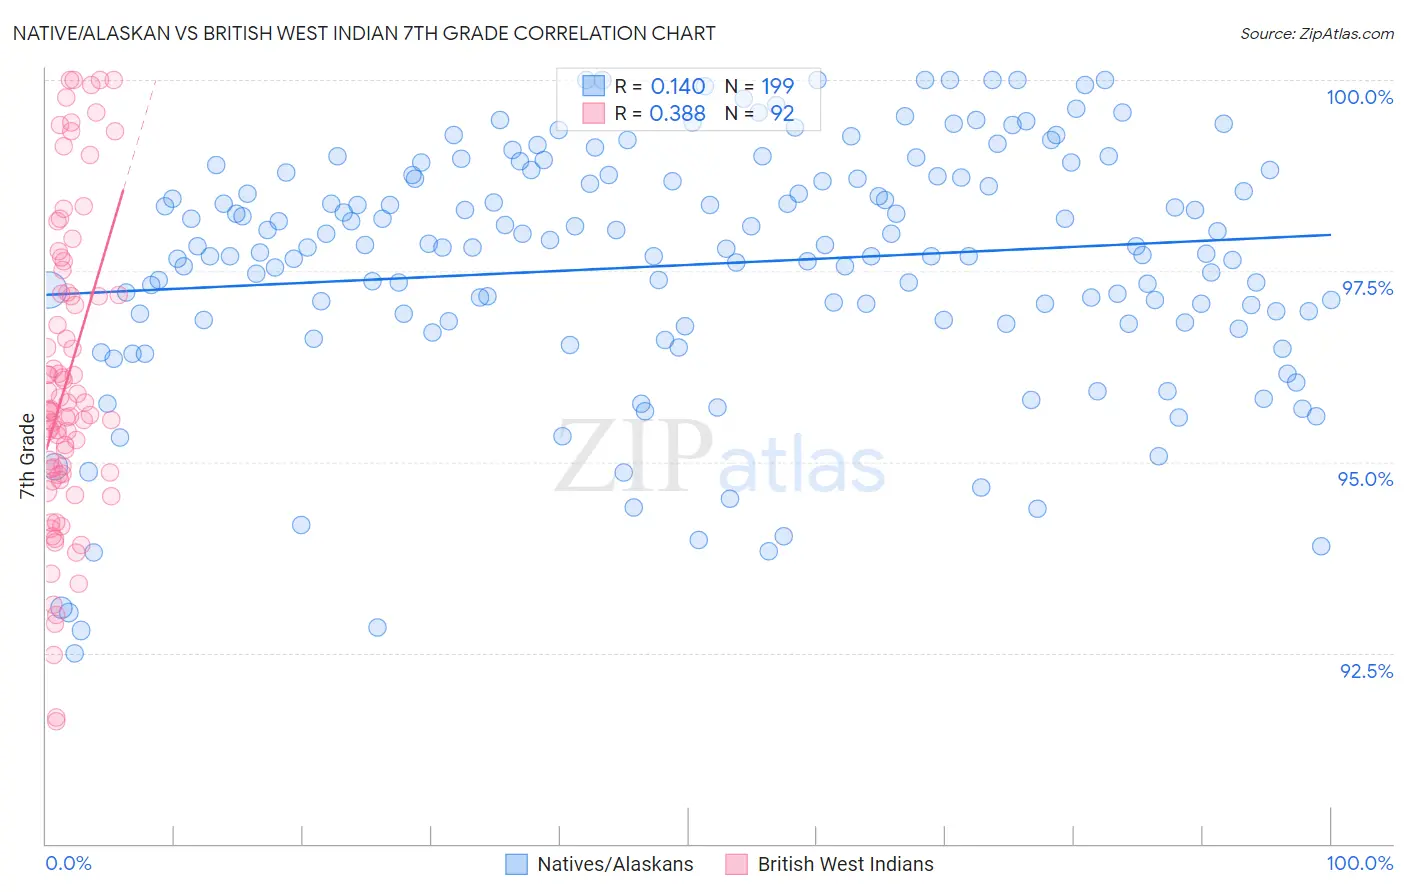
Native/Alaskan vs British West Indian 7th Grade Correlation Chart
The statistical analysis conducted on geographies consisting of 513,072,559 people shows a poor positive correlation between the proportion of Natives/Alaskans and percentage of population with at least 7th grade education in the United States with a correlation coefficient (R) of 0.140 and weighted average of 95.6%. Similarly, the statistical analysis conducted on geographies consisting of 152,691,173 people shows a mild positive correlation between the proportion of British West Indians and percentage of population with at least 7th grade education in the United States with a correlation coefficient (R) of 0.388 and weighted average of 94.8%, a difference of 0.77%.
7th Grade Correlation Summary
| Measurement | Native/Alaskan | British West Indian |
| Minimum | 92.5% | 91.6% |
| Maximum | 100.0% | 100.0% |
| Range | 7.5% | 8.4% |
| Mean | 97.6% | 96.1% |
| Median | 97.8% | 95.7% |
| Interquartile 25% (IQ1) | 96.8% | 94.8% |
| Interquartile 75% (IQ3) | 98.7% | 97.2% |
| Interquartile Range (IQR) | 1.9% | 2.4% |
| Standard Deviation (Sample) | 1.6% | 2.0% |
| Standard Deviation (Population) | 1.6% | 2.0% |
Similar Demographics by 7th Grade
Demographics Similar to Natives/Alaskans by 7th Grade
In terms of 7th grade, the demographic groups most similar to Natives/Alaskans are Senegalese (95.6%, a difference of 0.010%), Immigrants from Panama (95.6%, a difference of 0.020%), Immigrants from Eastern Africa (95.6%, a difference of 0.030%), Immigrants from Western Asia (95.6%, a difference of 0.040%), and Costa Rican (95.5%, a difference of 0.040%).
| Demographics | Rating | Rank | 7th Grade |
| Immigrants | Syria | 6.7 /100 | #223 | Tragic 95.7% |
| Immigrants | Oceania | 6.7 /100 | #224 | Tragic 95.7% |
| Immigrants | Malaysia | 6.2 /100 | #225 | Tragic 95.6% |
| Immigrants | Eastern Asia | 5.8 /100 | #226 | Tragic 95.6% |
| Immigrants | Western Asia | 5.4 /100 | #227 | Tragic 95.6% |
| Immigrants | Eastern Africa | 5.1 /100 | #228 | Tragic 95.6% |
| Immigrants | Panama | 4.9 /100 | #229 | Tragic 95.6% |
| Natives/Alaskans | 4.2 /100 | #230 | Tragic 95.6% |
| Senegalese | 4.0 /100 | #231 | Tragic 95.6% |
| Costa Ricans | 3.3 /100 | #232 | Tragic 95.5% |
| Immigrants | Indonesia | 3.3 /100 | #233 | Tragic 95.5% |
| Nigerians | 3.0 /100 | #234 | Tragic 95.5% |
| Immigrants | Africa | 2.7 /100 | #235 | Tragic 95.5% |
| Asians | 2.6 /100 | #236 | Tragic 95.5% |
| Immigrants | Asia | 2.3 /100 | #237 | Tragic 95.5% |
Demographics Similar to British West Indians by 7th Grade
In terms of 7th grade, the demographic groups most similar to British West Indians are Taiwanese (94.8%, a difference of 0.010%), Immigrants from Peru (94.9%, a difference of 0.020%), Immigrants from Philippines (94.9%, a difference of 0.030%), Malaysian (94.8%, a difference of 0.030%), and Immigrants from Grenada (94.8%, a difference of 0.070%).
| Demographics | Rating | Rank | 7th Grade |
| Tohono O'odham | 0.1 /100 | #281 | Tragic 95.0% |
| Immigrants | Bolivia | 0.1 /100 | #282 | Tragic 95.0% |
| Immigrants | Barbados | 0.1 /100 | #283 | Tragic 95.0% |
| Armenians | 0.1 /100 | #284 | Tragic 95.0% |
| Immigrants | Eritrea | 0.1 /100 | #285 | Tragic 94.9% |
| Immigrants | Philippines | 0.0 /100 | #286 | Tragic 94.9% |
| Immigrants | Peru | 0.0 /100 | #287 | Tragic 94.9% |
| British West Indians | 0.0 /100 | #288 | Tragic 94.8% |
| Taiwanese | 0.0 /100 | #289 | Tragic 94.8% |
| Malaysians | 0.0 /100 | #290 | Tragic 94.8% |
| Immigrants | Grenada | 0.0 /100 | #291 | Tragic 94.8% |
| Immigrants | West Indies | 0.0 /100 | #292 | Tragic 94.8% |
| Fijians | 0.0 /100 | #293 | Tragic 94.7% |
| Haitians | 0.0 /100 | #294 | Tragic 94.7% |
| Yaqui | 0.0 /100 | #295 | Tragic 94.6% |