Immigrants from Latin America vs British West Indian 7th Grade
COMPARE
Immigrants from Latin America
British West Indian
7th Grade
7th Grade Comparison
Immigrants from Latin America
British West Indians
92.2%
7TH GRADE
0.0/ 100
METRIC RATING
337th/ 347
METRIC RANK
94.8%
7TH GRADE
0.0/ 100
METRIC RATING
288th/ 347
METRIC RANK
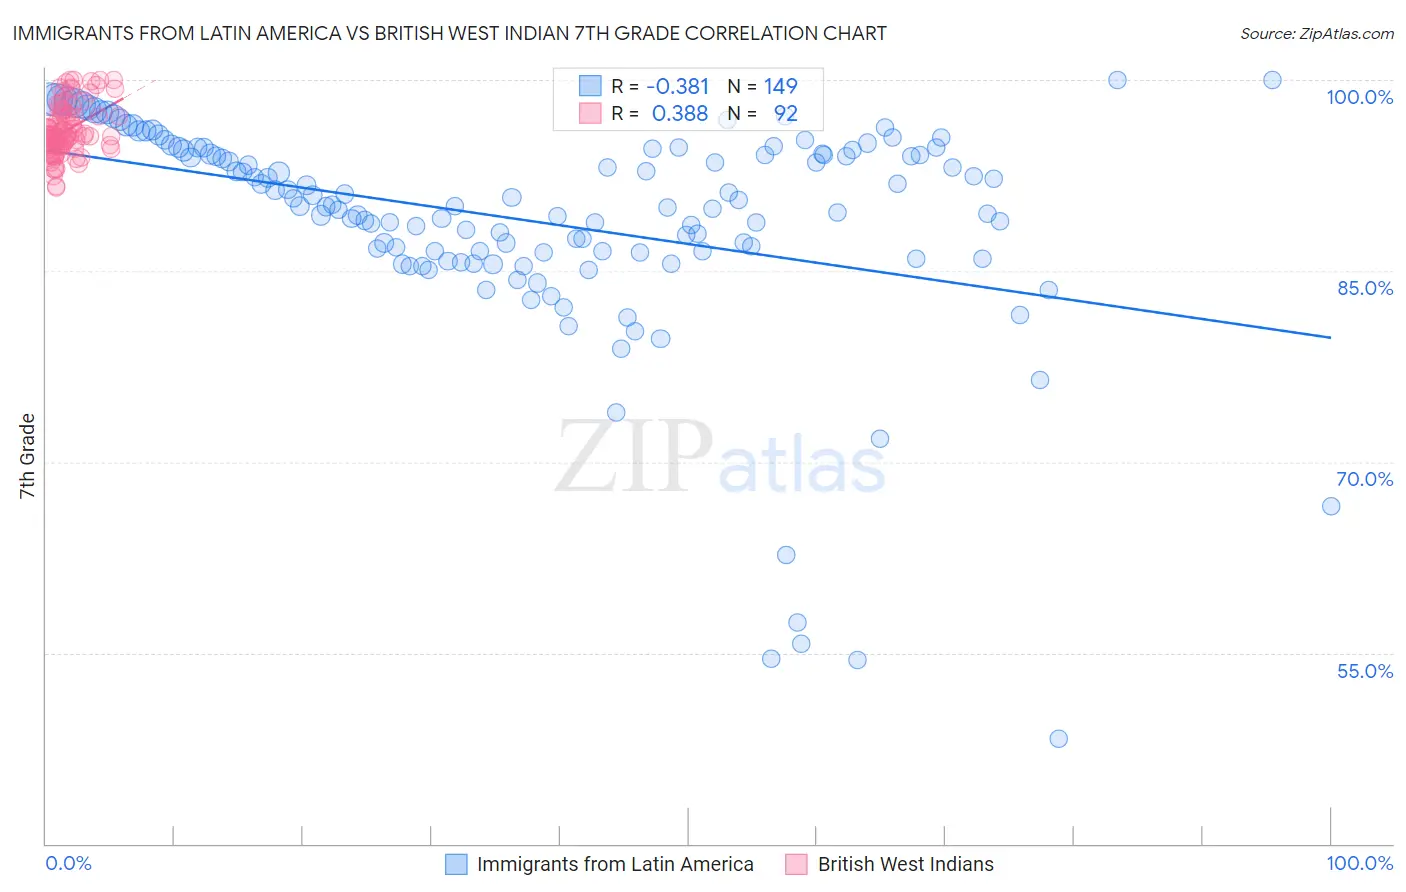
Immigrants from Latin America vs British West Indian 7th Grade Correlation Chart
The statistical analysis conducted on geographies consisting of 558,652,041 people shows a mild negative correlation between the proportion of Immigrants from Latin America and percentage of population with at least 7th grade education in the United States with a correlation coefficient (R) of -0.381 and weighted average of 92.2%. Similarly, the statistical analysis conducted on geographies consisting of 152,691,173 people shows a mild positive correlation between the proportion of British West Indians and percentage of population with at least 7th grade education in the United States with a correlation coefficient (R) of 0.388 and weighted average of 94.8%, a difference of 2.8%.
7th Grade Correlation Summary
| Measurement | Immigrants from Latin America | British West Indian |
| Minimum | 48.3% | 91.6% |
| Maximum | 100.0% | 100.0% |
| Range | 51.7% | 8.4% |
| Mean | 88.9% | 96.1% |
| Median | 90.1% | 95.7% |
| Interquartile 25% (IQ1) | 86.5% | 94.8% |
| Interquartile 75% (IQ3) | 94.5% | 97.2% |
| Interquartile Range (IQR) | 8.0% | 2.4% |
| Standard Deviation (Sample) | 8.9% | 2.0% |
| Standard Deviation (Population) | 8.8% | 2.0% |
Similar Demographics by 7th Grade
Demographics Similar to Immigrants from Latin America by 7th Grade
In terms of 7th grade, the demographic groups most similar to Immigrants from Latin America are Central American (92.1%, a difference of 0.13%), Immigrants from Honduras (92.5%, a difference of 0.27%), Mexican American Indian (92.6%, a difference of 0.34%), Mexican (91.9%, a difference of 0.38%), and Immigrants from Yemen (92.6%, a difference of 0.44%).
| Demographics | Rating | Rank | 7th Grade |
| Immigrants | Dominican Republic | 0.0 /100 | #330 | Tragic 92.9% |
| Hondurans | 0.0 /100 | #331 | Tragic 92.9% |
| Hispanics or Latinos | 0.0 /100 | #332 | Tragic 92.7% |
| Immigrants | Armenia | 0.0 /100 | #333 | Tragic 92.7% |
| Immigrants | Yemen | 0.0 /100 | #334 | Tragic 92.6% |
| Mexican American Indians | 0.0 /100 | #335 | Tragic 92.6% |
| Immigrants | Honduras | 0.0 /100 | #336 | Tragic 92.5% |
| Immigrants | Latin America | 0.0 /100 | #337 | Tragic 92.2% |
| Central Americans | 0.0 /100 | #338 | Tragic 92.1% |
| Mexicans | 0.0 /100 | #339 | Tragic 91.9% |
| Yakama | 0.0 /100 | #340 | Tragic 91.7% |
| Guatemalans | 0.0 /100 | #341 | Tragic 91.7% |
| Salvadorans | 0.0 /100 | #342 | Tragic 91.5% |
| Immigrants | Guatemala | 0.0 /100 | #343 | Tragic 91.3% |
| Immigrants | Central America | 0.0 /100 | #344 | Tragic 91.0% |
Demographics Similar to British West Indians by 7th Grade
In terms of 7th grade, the demographic groups most similar to British West Indians are Taiwanese (94.8%, a difference of 0.010%), Immigrants from Peru (94.9%, a difference of 0.020%), Immigrants from Philippines (94.9%, a difference of 0.030%), Malaysian (94.8%, a difference of 0.030%), and Immigrants from Grenada (94.8%, a difference of 0.070%).
| Demographics | Rating | Rank | 7th Grade |
| Tohono O'odham | 0.1 /100 | #281 | Tragic 95.0% |
| Immigrants | Bolivia | 0.1 /100 | #282 | Tragic 95.0% |
| Immigrants | Barbados | 0.1 /100 | #283 | Tragic 95.0% |
| Armenians | 0.1 /100 | #284 | Tragic 95.0% |
| Immigrants | Eritrea | 0.1 /100 | #285 | Tragic 94.9% |
| Immigrants | Philippines | 0.0 /100 | #286 | Tragic 94.9% |
| Immigrants | Peru | 0.0 /100 | #287 | Tragic 94.9% |
| British West Indians | 0.0 /100 | #288 | Tragic 94.8% |
| Taiwanese | 0.0 /100 | #289 | Tragic 94.8% |
| Malaysians | 0.0 /100 | #290 | Tragic 94.8% |
| Immigrants | Grenada | 0.0 /100 | #291 | Tragic 94.8% |
| Immigrants | West Indies | 0.0 /100 | #292 | Tragic 94.8% |
| Fijians | 0.0 /100 | #293 | Tragic 94.7% |
| Haitians | 0.0 /100 | #294 | Tragic 94.7% |
| Yaqui | 0.0 /100 | #295 | Tragic 94.6% |