Immigrants from Bosnia and Herzegovina vs British West Indian 7th Grade
COMPARE
Immigrants from Bosnia and Herzegovina
British West Indian
7th Grade
7th Grade Comparison
Immigrants from Bosnia and Herzegovina
British West Indians
96.4%
7TH GRADE
93.3/ 100
METRIC RATING
127th/ 347
METRIC RANK
94.8%
7TH GRADE
0.0/ 100
METRIC RATING
288th/ 347
METRIC RANK
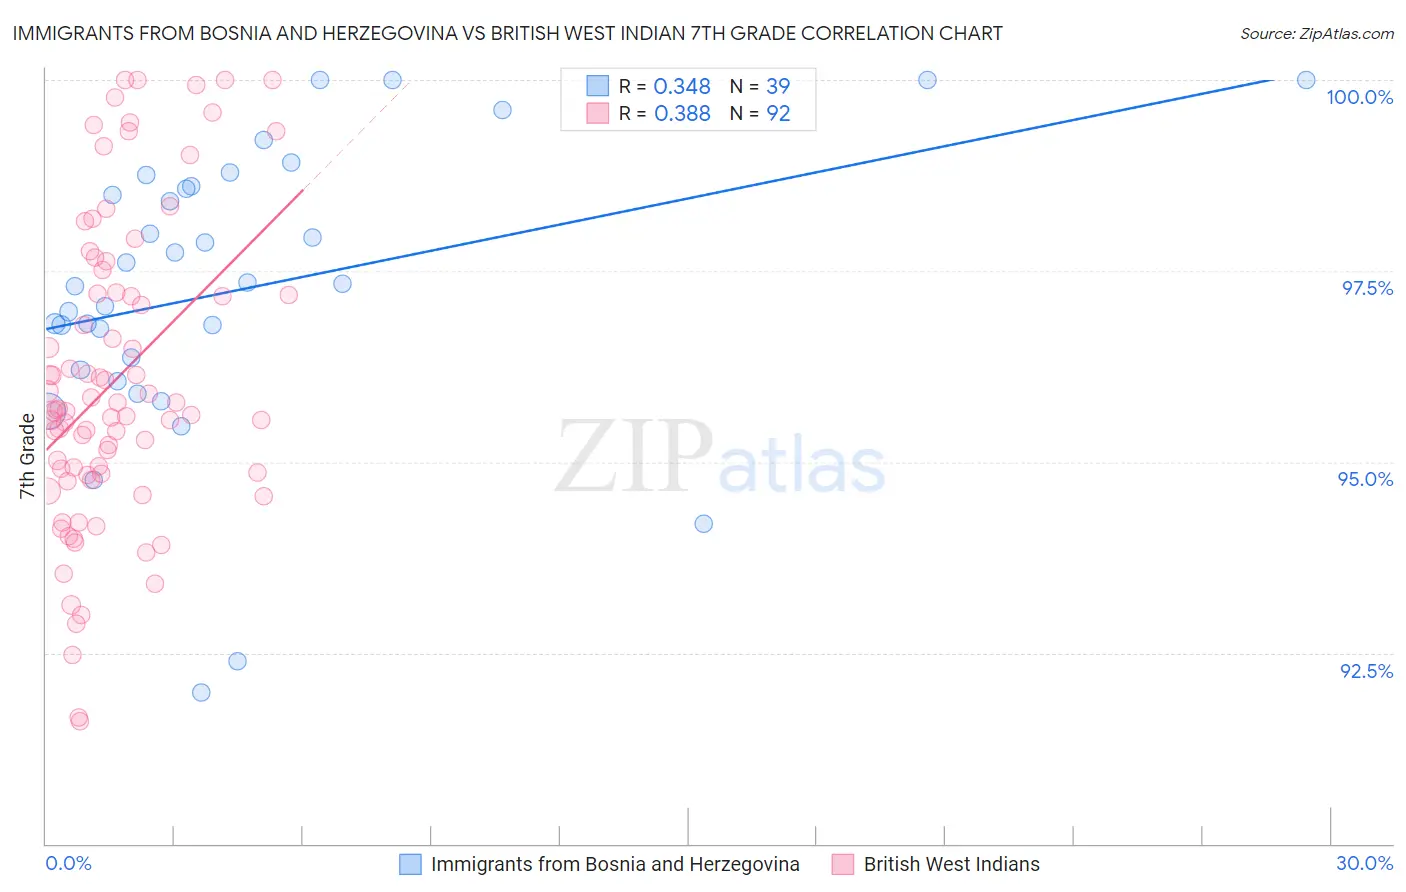
Immigrants from Bosnia and Herzegovina vs British West Indian 7th Grade Correlation Chart
The statistical analysis conducted on geographies consisting of 156,779,463 people shows a mild positive correlation between the proportion of Immigrants from Bosnia and Herzegovina and percentage of population with at least 7th grade education in the United States with a correlation coefficient (R) of 0.348 and weighted average of 96.4%. Similarly, the statistical analysis conducted on geographies consisting of 152,691,173 people shows a mild positive correlation between the proportion of British West Indians and percentage of population with at least 7th grade education in the United States with a correlation coefficient (R) of 0.388 and weighted average of 94.8%, a difference of 1.7%.
7th Grade Correlation Summary
| Measurement | Immigrants from Bosnia and Herzegovina | British West Indian |
| Minimum | 92.0% | 91.6% |
| Maximum | 100.0% | 100.0% |
| Range | 8.0% | 8.4% |
| Mean | 97.3% | 96.1% |
| Median | 97.3% | 95.7% |
| Interquartile 25% (IQ1) | 96.2% | 94.8% |
| Interquartile 75% (IQ3) | 98.6% | 97.2% |
| Interquartile Range (IQR) | 2.4% | 2.4% |
| Standard Deviation (Sample) | 1.9% | 2.0% |
| Standard Deviation (Population) | 1.9% | 2.0% |
Similar Demographics by 7th Grade
Demographics Similar to Immigrants from Bosnia and Herzegovina by 7th Grade
In terms of 7th grade, the demographic groups most similar to Immigrants from Bosnia and Herzegovina are Palestinian (96.4%, a difference of 0.0%), Immigrants from Romania (96.4%, a difference of 0.0%), Immigrants from North Macedonia (96.4%, a difference of 0.010%), Immigrants from Serbia (96.4%, a difference of 0.010%), and Immigrants from Bulgaria (96.4%, a difference of 0.020%).
| Demographics | Rating | Rank | 7th Grade |
| Immigrants | Croatia | 95.0 /100 | #120 | Exceptional 96.5% |
| Cheyenne | 94.9 /100 | #121 | Exceptional 96.5% |
| Immigrants | Europe | 94.8 /100 | #122 | Exceptional 96.5% |
| Immigrants | France | 94.7 /100 | #123 | Exceptional 96.5% |
| Immigrants | Switzerland | 94.5 /100 | #124 | Exceptional 96.5% |
| Immigrants | Bulgaria | 94.0 /100 | #125 | Exceptional 96.4% |
| Palestinians | 93.5 /100 | #126 | Exceptional 96.4% |
| Immigrants | Bosnia and Herzegovina | 93.3 /100 | #127 | Exceptional 96.4% |
| Immigrants | Romania | 93.2 /100 | #128 | Exceptional 96.4% |
| Immigrants | North Macedonia | 93.1 /100 | #129 | Exceptional 96.4% |
| Immigrants | Serbia | 92.8 /100 | #130 | Exceptional 96.4% |
| Filipinos | 92.1 /100 | #131 | Exceptional 96.4% |
| Colville | 91.7 /100 | #132 | Exceptional 96.4% |
| Hmong | 91.5 /100 | #133 | Exceptional 96.4% |
| Soviet Union | 91.2 /100 | #134 | Exceptional 96.4% |
Demographics Similar to British West Indians by 7th Grade
In terms of 7th grade, the demographic groups most similar to British West Indians are Taiwanese (94.8%, a difference of 0.010%), Immigrants from Peru (94.9%, a difference of 0.020%), Immigrants from Philippines (94.9%, a difference of 0.030%), Malaysian (94.8%, a difference of 0.030%), and Immigrants from Grenada (94.8%, a difference of 0.070%).
| Demographics | Rating | Rank | 7th Grade |
| Tohono O'odham | 0.1 /100 | #281 | Tragic 95.0% |
| Immigrants | Bolivia | 0.1 /100 | #282 | Tragic 95.0% |
| Immigrants | Barbados | 0.1 /100 | #283 | Tragic 95.0% |
| Armenians | 0.1 /100 | #284 | Tragic 95.0% |
| Immigrants | Eritrea | 0.1 /100 | #285 | Tragic 94.9% |
| Immigrants | Philippines | 0.0 /100 | #286 | Tragic 94.9% |
| Immigrants | Peru | 0.0 /100 | #287 | Tragic 94.9% |
| British West Indians | 0.0 /100 | #288 | Tragic 94.8% |
| Taiwanese | 0.0 /100 | #289 | Tragic 94.8% |
| Malaysians | 0.0 /100 | #290 | Tragic 94.8% |
| Immigrants | Grenada | 0.0 /100 | #291 | Tragic 94.8% |
| Immigrants | West Indies | 0.0 /100 | #292 | Tragic 94.8% |
| Fijians | 0.0 /100 | #293 | Tragic 94.7% |
| Haitians | 0.0 /100 | #294 | Tragic 94.7% |
| Yaqui | 0.0 /100 | #295 | Tragic 94.6% |