Tsimshian vs Burmese Master's Degree
COMPARE
Tsimshian
Burmese
Master's Degree
Master's Degree Comparison
Tsimshian
Burmese
11.4%
MASTER'S DEGREE
0.1/ 100
METRIC RATING
301st/ 347
METRIC RANK
19.7%
MASTER'S DEGREE
100.0/ 100
METRIC RATING
32nd/ 347
METRIC RANK
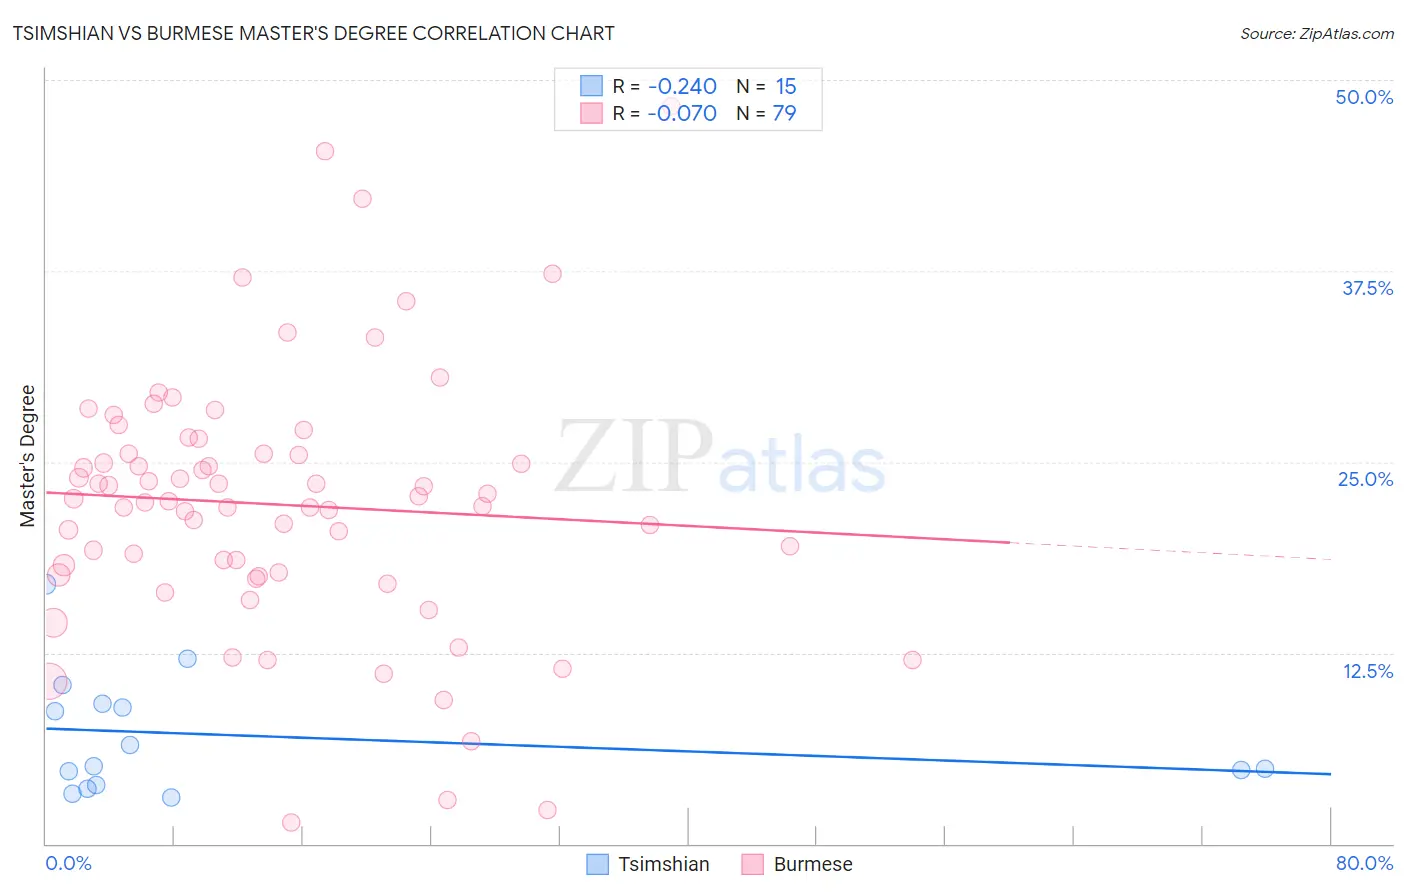
Tsimshian vs Burmese Master's Degree Correlation Chart
The statistical analysis conducted on geographies consisting of 15,626,544 people shows a weak negative correlation between the proportion of Tsimshian and percentage of population with at least master's degree education in the United States with a correlation coefficient (R) of -0.240 and weighted average of 11.4%. Similarly, the statistical analysis conducted on geographies consisting of 465,142,202 people shows a slight negative correlation between the proportion of Burmese and percentage of population with at least master's degree education in the United States with a correlation coefficient (R) of -0.070 and weighted average of 19.7%, a difference of 72.8%.
Master's Degree Correlation Summary
| Measurement | Tsimshian | Burmese |
| Minimum | 3.0% | 1.4% |
| Maximum | 17.0% | 48.2% |
| Range | 14.0% | 46.8% |
| Mean | 7.1% | 22.2% |
| Median | 5.0% | 22.5% |
| Interquartile 25% (IQ1) | 3.8% | 17.6% |
| Interquartile 75% (IQ3) | 9.2% | 25.5% |
| Interquartile Range (IQR) | 5.3% | 8.0% |
| Standard Deviation (Sample) | 4.0% | 8.6% |
| Standard Deviation (Population) | 3.8% | 8.5% |
Similar Demographics by Master's Degree
Demographics Similar to Tsimshian by Master's Degree
In terms of master's degree, the demographic groups most similar to Tsimshian are Chippewa (11.4%, a difference of 0.16%), Chickasaw (11.4%, a difference of 0.18%), Cherokee (11.4%, a difference of 0.31%), Immigrants from Laos (11.4%, a difference of 0.33%), and Immigrants from Cabo Verde (11.3%, a difference of 0.52%).
| Demographics | Rating | Rank | Master's Degree |
| Hawaiians | 0.1 /100 | #294 | Tragic 11.6% |
| Marshallese | 0.1 /100 | #295 | Tragic 11.6% |
| Alaskan Athabascans | 0.1 /100 | #296 | Tragic 11.6% |
| Immigrants | Yemen | 0.1 /100 | #297 | Tragic 11.6% |
| Samoans | 0.1 /100 | #298 | Tragic 11.5% |
| Chickasaw | 0.1 /100 | #299 | Tragic 11.4% |
| Chippewa | 0.1 /100 | #300 | Tragic 11.4% |
| Tsimshian | 0.1 /100 | #301 | Tragic 11.4% |
| Cherokee | 0.1 /100 | #302 | Tragic 11.4% |
| Immigrants | Laos | 0.1 /100 | #303 | Tragic 11.4% |
| Immigrants | Cabo Verde | 0.1 /100 | #304 | Tragic 11.3% |
| Immigrants | Latin America | 0.0 /100 | #305 | Tragic 11.3% |
| Mexican American Indians | 0.0 /100 | #306 | Tragic 11.2% |
| Cheyenne | 0.0 /100 | #307 | Tragic 11.2% |
| Puerto Ricans | 0.0 /100 | #308 | Tragic 11.2% |
Demographics Similar to Burmese by Master's Degree
In terms of master's degree, the demographic groups most similar to Burmese are Immigrants from Korea (19.7%, a difference of 0.070%), Immigrants from Turkey (19.7%, a difference of 0.080%), Latvian (19.8%, a difference of 0.58%), Russian (19.5%, a difference of 0.79%), and Immigrants from Denmark (19.5%, a difference of 0.81%).
| Demographics | Rating | Rank | Master's Degree |
| Immigrants | Japan | 100.0 /100 | #25 | Exceptional 20.0% |
| Cambodians | 100.0 /100 | #26 | Exceptional 20.0% |
| Immigrants | Sri Lanka | 100.0 /100 | #27 | Exceptional 19.9% |
| Turks | 100.0 /100 | #28 | Exceptional 19.9% |
| Latvians | 100.0 /100 | #29 | Exceptional 19.8% |
| Immigrants | Turkey | 100.0 /100 | #30 | Exceptional 19.7% |
| Immigrants | Korea | 100.0 /100 | #31 | Exceptional 19.7% |
| Burmese | 100.0 /100 | #32 | Exceptional 19.7% |
| Russians | 100.0 /100 | #33 | Exceptional 19.5% |
| Immigrants | Denmark | 100.0 /100 | #34 | Exceptional 19.5% |
| Immigrants | Northern Europe | 100.0 /100 | #35 | Exceptional 19.5% |
| Immigrants | Russia | 100.0 /100 | #36 | Exceptional 19.4% |
| Mongolians | 100.0 /100 | #37 | Exceptional 19.4% |
| Bolivians | 100.0 /100 | #38 | Exceptional 19.3% |
| Immigrants | Spain | 100.0 /100 | #39 | Exceptional 19.1% |