Tongan vs Immigrants from Albania Professional Degree
COMPARE
Tongan
Immigrants from Albania
Professional Degree
Professional Degree Comparison
Tongans
Immigrants from Albania
3.7%
PROFESSIONAL DEGREE
1.3/ 100
METRIC RATING
254th/ 347
METRIC RANK
4.8%
PROFESSIONAL DEGREE
93.3/ 100
METRIC RATING
125th/ 347
METRIC RANK
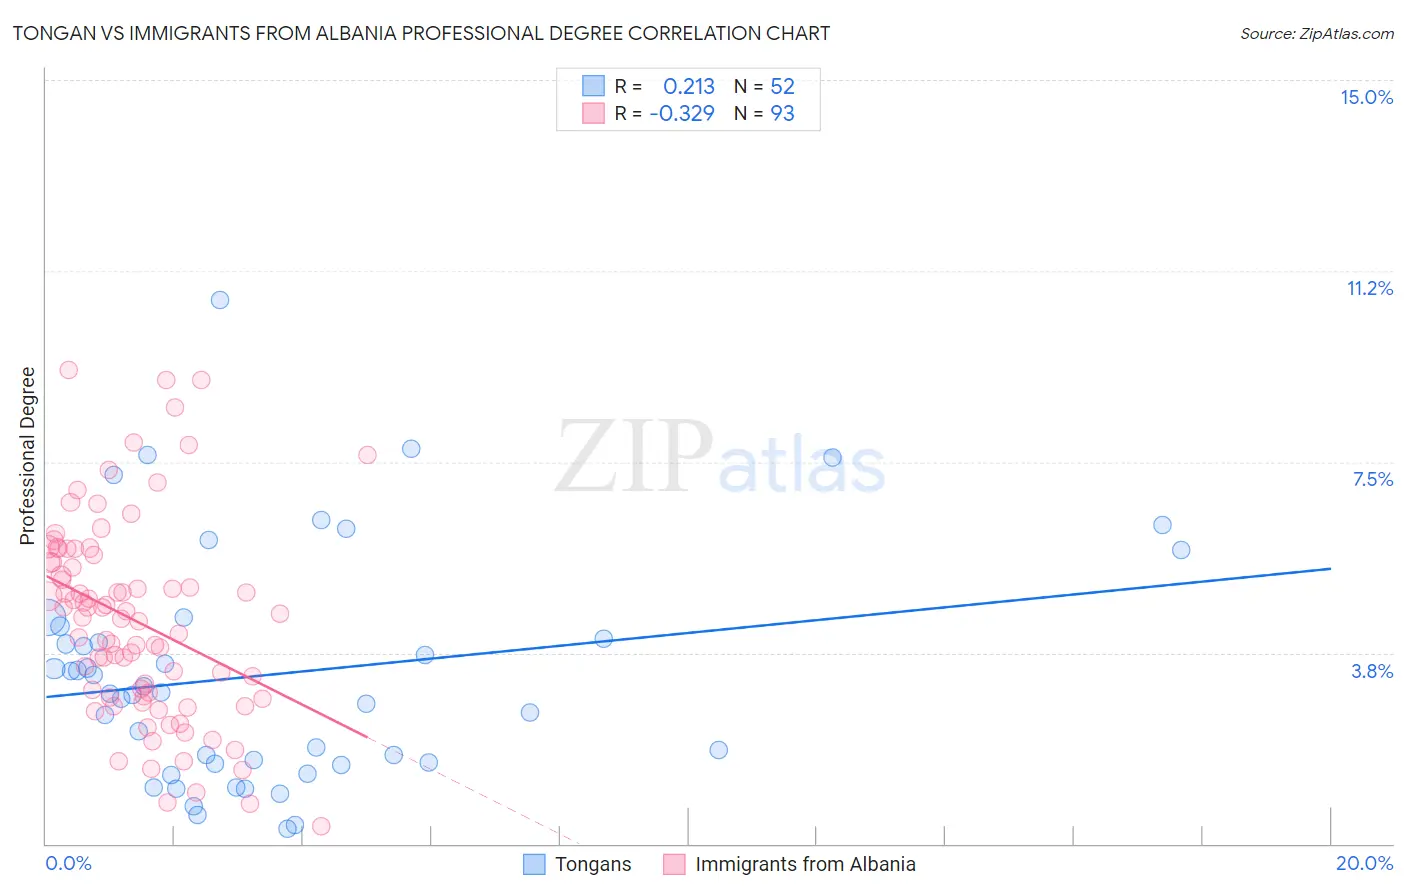
Tongan vs Immigrants from Albania Professional Degree Correlation Chart
The statistical analysis conducted on geographies consisting of 102,718,733 people shows a weak positive correlation between the proportion of Tongans and percentage of population with at least professional degree education in the United States with a correlation coefficient (R) of 0.213 and weighted average of 3.7%. Similarly, the statistical analysis conducted on geographies consisting of 119,335,838 people shows a mild negative correlation between the proportion of Immigrants from Albania and percentage of population with at least professional degree education in the United States with a correlation coefficient (R) of -0.329 and weighted average of 4.8%, a difference of 29.9%.
Professional Degree Correlation Summary
| Measurement | Tongan | Immigrants from Albania |
| Minimum | 0.30% | 0.35% |
| Maximum | 10.7% | 9.3% |
| Range | 10.4% | 8.9% |
| Mean | 3.3% | 4.4% |
| Median | 3.0% | 4.4% |
| Interquartile 25% (IQ1) | 1.6% | 2.9% |
| Interquartile 75% (IQ3) | 4.2% | 5.6% |
| Interquartile Range (IQR) | 2.6% | 2.7% |
| Standard Deviation (Sample) | 2.3% | 2.0% |
| Standard Deviation (Population) | 2.2% | 1.9% |
Similar Demographics by Professional Degree
Demographics Similar to Tongans by Professional Degree
In terms of professional degree, the demographic groups most similar to Tongans are Pueblo (3.7%, a difference of 0.14%), Jamaican (3.7%, a difference of 0.24%), Immigrants from Nicaragua (3.7%, a difference of 0.39%), Osage (3.7%, a difference of 0.43%), and Iroquois (3.7%, a difference of 0.53%).
| Demographics | Rating | Rank | Professional Degree |
| Guyanese | 1.6 /100 | #247 | Tragic 3.8% |
| Hmong | 1.6 /100 | #248 | Tragic 3.7% |
| Immigrants | Grenada | 1.5 /100 | #249 | Tragic 3.7% |
| Immigrants | Fiji | 1.5 /100 | #250 | Tragic 3.7% |
| Immigrants | Nicaragua | 1.4 /100 | #251 | Tragic 3.7% |
| Jamaicans | 1.4 /100 | #252 | Tragic 3.7% |
| Pueblo | 1.4 /100 | #253 | Tragic 3.7% |
| Tongans | 1.3 /100 | #254 | Tragic 3.7% |
| Osage | 1.2 /100 | #255 | Tragic 3.7% |
| Iroquois | 1.2 /100 | #256 | Tragic 3.7% |
| Bahamians | 1.1 /100 | #257 | Tragic 3.7% |
| Immigrants | St. Vincent and the Grenadines | 1.1 /100 | #258 | Tragic 3.7% |
| Africans | 1.0 /100 | #259 | Tragic 3.7% |
| Indonesians | 1.0 /100 | #260 | Tragic 3.7% |
| Immigrants | Guyana | 1.0 /100 | #261 | Tragic 3.7% |
Demographics Similar to Immigrants from Albania by Professional Degree
In terms of professional degree, the demographic groups most similar to Immigrants from Albania are European (4.8%, a difference of 0.050%), Immigrants from Eritrea (4.8%, a difference of 0.12%), Immigrants from Venezuela (4.8%, a difference of 0.31%), Serbian (4.8%, a difference of 0.35%), and Immigrants from Eastern Africa (4.8%, a difference of 0.37%).
| Demographics | Rating | Rank | Professional Degree |
| Croatians | 96.0 /100 | #118 | Exceptional 4.9% |
| Immigrants | Sudan | 95.4 /100 | #119 | Exceptional 4.9% |
| Albanians | 95.3 /100 | #120 | Exceptional 4.9% |
| Immigrants | Moldova | 94.8 /100 | #121 | Exceptional 4.9% |
| Immigrants | Germany | 94.1 /100 | #122 | Exceptional 4.9% |
| Immigrants | Venezuela | 93.8 /100 | #123 | Exceptional 4.8% |
| Immigrants | Eritrea | 93.5 /100 | #124 | Exceptional 4.8% |
| Immigrants | Albania | 93.3 /100 | #125 | Exceptional 4.8% |
| Europeans | 93.2 /100 | #126 | Exceptional 4.8% |
| Serbians | 92.6 /100 | #127 | Exceptional 4.8% |
| Immigrants | Eastern Africa | 92.5 /100 | #128 | Exceptional 4.8% |
| Palestinians | 91.5 /100 | #129 | Exceptional 4.8% |
| Icelanders | 91.5 /100 | #130 | Exceptional 4.8% |
| Immigrants | Nepal | 91.4 /100 | #131 | Exceptional 4.8% |
| Pakistanis | 90.9 /100 | #132 | Exceptional 4.8% |