Immigrants from Western Africa vs Immigrants from Albania Professional Degree
COMPARE
Immigrants from Western Africa
Immigrants from Albania
Professional Degree
Professional Degree Comparison
Immigrants from Western Africa
Immigrants from Albania
4.0%
PROFESSIONAL DEGREE
7.5/ 100
METRIC RATING
222nd/ 347
METRIC RANK
4.8%
PROFESSIONAL DEGREE
93.3/ 100
METRIC RATING
125th/ 347
METRIC RANK
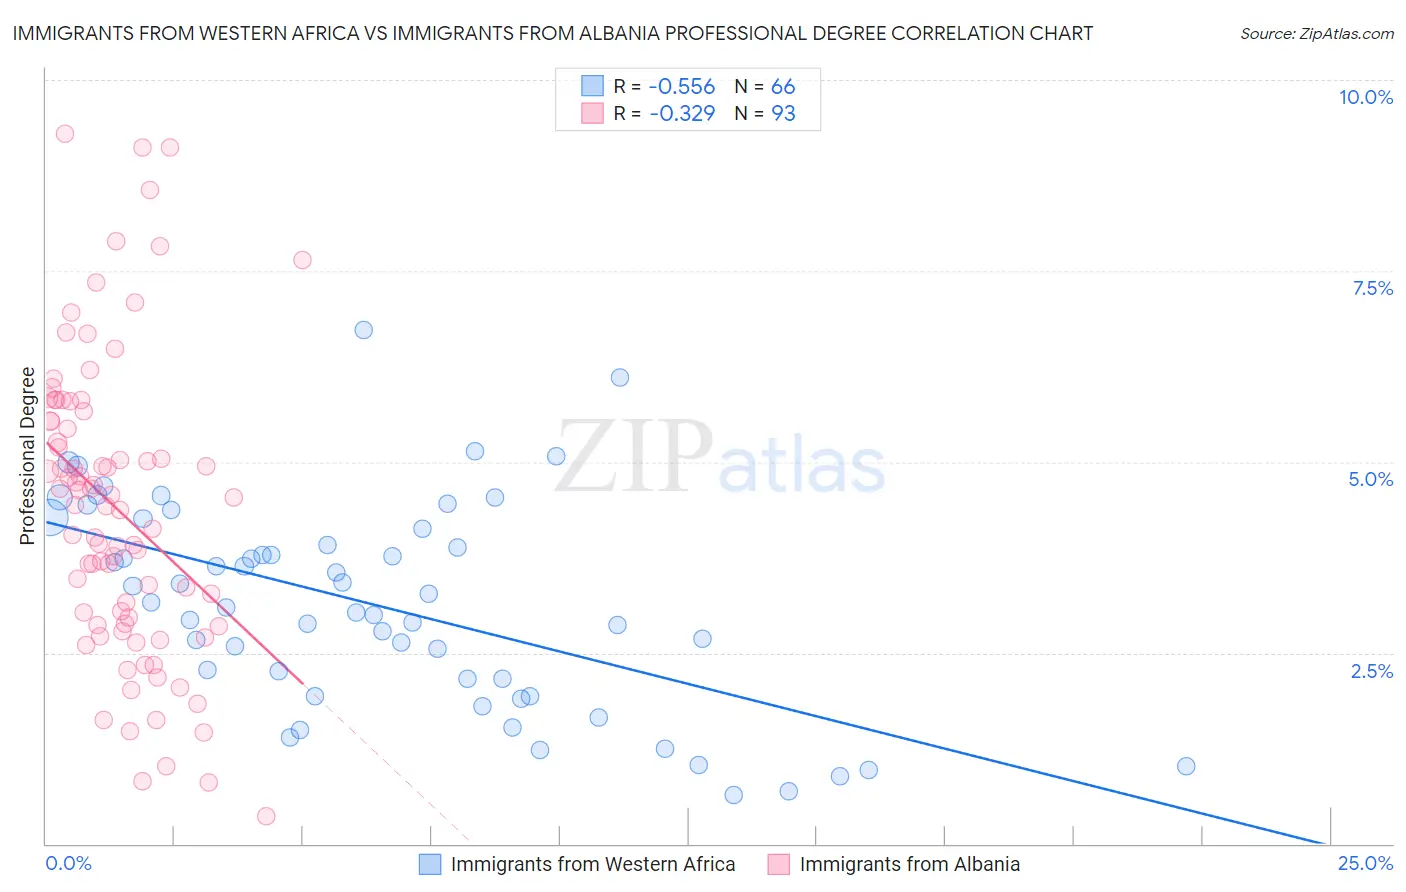
Immigrants from Western Africa vs Immigrants from Albania Professional Degree Correlation Chart
The statistical analysis conducted on geographies consisting of 357,190,619 people shows a substantial negative correlation between the proportion of Immigrants from Western Africa and percentage of population with at least professional degree education in the United States with a correlation coefficient (R) of -0.556 and weighted average of 4.0%. Similarly, the statistical analysis conducted on geographies consisting of 119,335,838 people shows a mild negative correlation between the proportion of Immigrants from Albania and percentage of population with at least professional degree education in the United States with a correlation coefficient (R) of -0.329 and weighted average of 4.8%, a difference of 20.5%.
Professional Degree Correlation Summary
| Measurement | Immigrants from Western Africa | Immigrants from Albania |
| Minimum | 0.64% | 0.35% |
| Maximum | 6.7% | 9.3% |
| Range | 6.1% | 8.9% |
| Mean | 3.1% | 4.4% |
| Median | 3.1% | 4.4% |
| Interquartile 25% (IQ1) | 2.2% | 2.9% |
| Interquartile 75% (IQ3) | 4.1% | 5.6% |
| Interquartile Range (IQR) | 2.0% | 2.7% |
| Standard Deviation (Sample) | 1.4% | 2.0% |
| Standard Deviation (Population) | 1.3% | 1.9% |
Similar Demographics by Professional Degree
Demographics Similar to Immigrants from Western Africa by Professional Degree
In terms of professional degree, the demographic groups most similar to Immigrants from Western Africa are Immigrants from Bosnia and Herzegovina (4.0%, a difference of 0.080%), Trinidadian and Tobagonian (4.0%, a difference of 0.22%), French Canadian (4.0%, a difference of 0.25%), Tlingit-Haida (4.0%, a difference of 0.35%), and Ute (4.0%, a difference of 0.38%).
| Demographics | Rating | Rank | Professional Degree |
| Portuguese | 10.5 /100 | #215 | Poor 4.1% |
| West Indians | 9.8 /100 | #216 | Tragic 4.1% |
| Immigrants | Vietnam | 9.4 /100 | #217 | Tragic 4.0% |
| Dutch | 9.0 /100 | #218 | Tragic 4.0% |
| Immigrants | South Eastern Asia | 8.9 /100 | #219 | Tragic 4.0% |
| Ute | 8.2 /100 | #220 | Tragic 4.0% |
| French Canadians | 8.0 /100 | #221 | Tragic 4.0% |
| Immigrants | Western Africa | 7.5 /100 | #222 | Tragic 4.0% |
| Immigrants | Bosnia and Herzegovina | 7.4 /100 | #223 | Tragic 4.0% |
| Trinidadians and Tobagonians | 7.1 /100 | #224 | Tragic 4.0% |
| Tlingit-Haida | 6.9 /100 | #225 | Tragic 4.0% |
| German Russians | 6.1 /100 | #226 | Tragic 4.0% |
| Cubans | 5.9 /100 | #227 | Tragic 4.0% |
| Immigrants | West Indies | 5.6 /100 | #228 | Tragic 4.0% |
| Immigrants | Burma/Myanmar | 5.4 /100 | #229 | Tragic 3.9% |
Demographics Similar to Immigrants from Albania by Professional Degree
In terms of professional degree, the demographic groups most similar to Immigrants from Albania are European (4.8%, a difference of 0.050%), Immigrants from Eritrea (4.8%, a difference of 0.12%), Immigrants from Venezuela (4.8%, a difference of 0.31%), Serbian (4.8%, a difference of 0.35%), and Immigrants from Eastern Africa (4.8%, a difference of 0.37%).
| Demographics | Rating | Rank | Professional Degree |
| Croatians | 96.0 /100 | #118 | Exceptional 4.9% |
| Immigrants | Sudan | 95.4 /100 | #119 | Exceptional 4.9% |
| Albanians | 95.3 /100 | #120 | Exceptional 4.9% |
| Immigrants | Moldova | 94.8 /100 | #121 | Exceptional 4.9% |
| Immigrants | Germany | 94.1 /100 | #122 | Exceptional 4.9% |
| Immigrants | Venezuela | 93.8 /100 | #123 | Exceptional 4.8% |
| Immigrants | Eritrea | 93.5 /100 | #124 | Exceptional 4.8% |
| Immigrants | Albania | 93.3 /100 | #125 | Exceptional 4.8% |
| Europeans | 93.2 /100 | #126 | Exceptional 4.8% |
| Serbians | 92.6 /100 | #127 | Exceptional 4.8% |
| Immigrants | Eastern Africa | 92.5 /100 | #128 | Exceptional 4.8% |
| Palestinians | 91.5 /100 | #129 | Exceptional 4.8% |
| Icelanders | 91.5 /100 | #130 | Exceptional 4.8% |
| Immigrants | Nepal | 91.4 /100 | #131 | Exceptional 4.8% |
| Pakistanis | 90.9 /100 | #132 | Exceptional 4.8% |