Trinidadian and Tobagonian vs Peruvian Female Unemployment
COMPARE
Trinidadian and Tobagonian
Peruvian
Female Unemployment
Female Unemployment Comparison
Trinidadians and Tobagonians
Peruvians
6.1%
FEMALE UNEMPLOYMENT
0.0/ 100
METRIC RATING
289th/ 347
METRIC RANK
5.4%
FEMALE UNEMPLOYMENT
9.6/ 100
METRIC RATING
217th/ 347
METRIC RANK
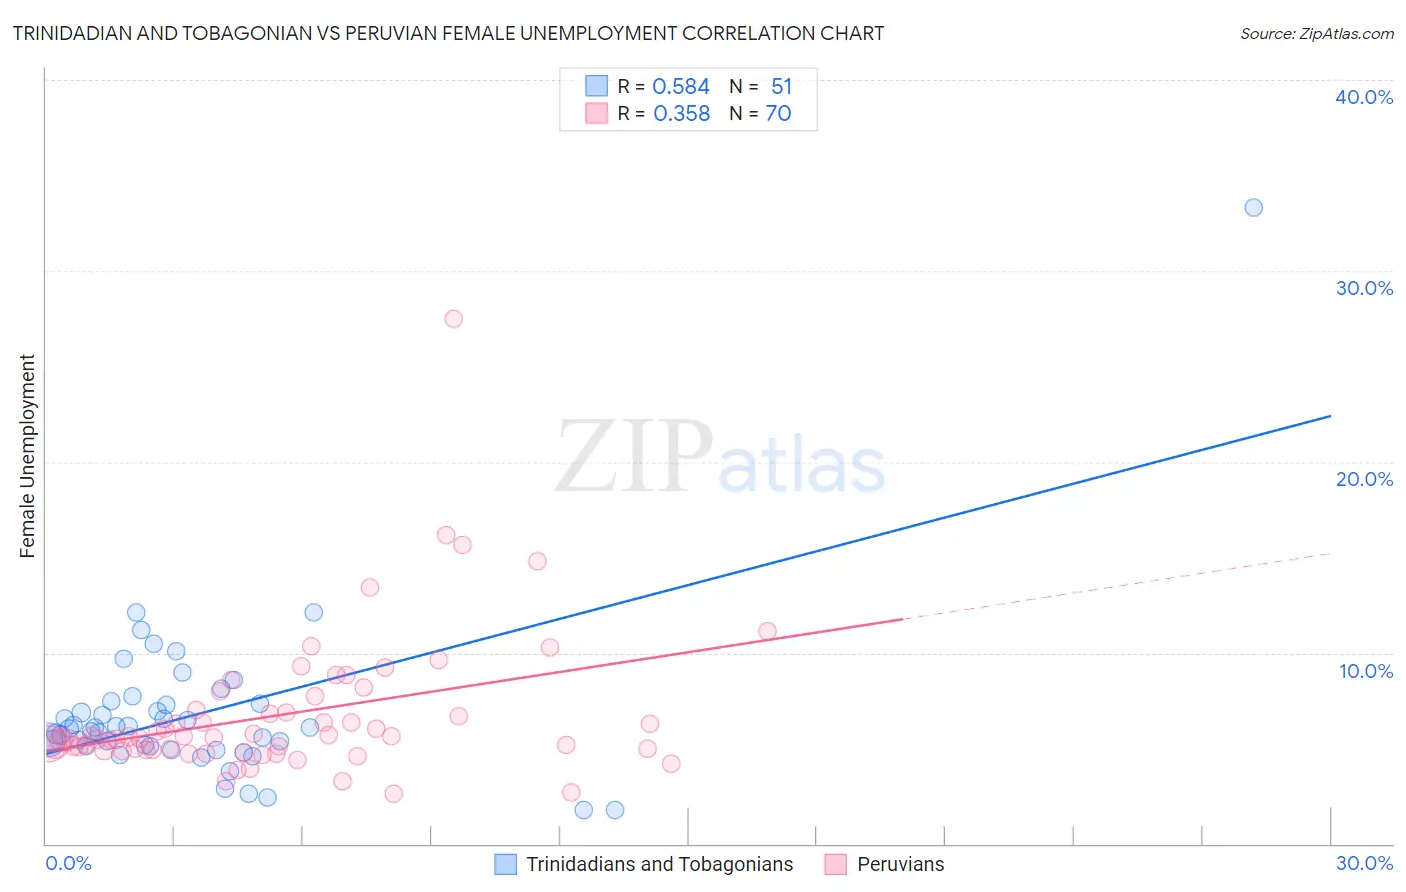
Trinidadian and Tobagonian vs Peruvian Female Unemployment Correlation Chart
The statistical analysis conducted on geographies consisting of 219,519,508 people shows a substantial positive correlation between the proportion of Trinidadians and Tobagonians and unemploymnet rate among females in the United States with a correlation coefficient (R) of 0.584 and weighted average of 6.1%. Similarly, the statistical analysis conducted on geographies consisting of 362,221,482 people shows a mild positive correlation between the proportion of Peruvians and unemploymnet rate among females in the United States with a correlation coefficient (R) of 0.358 and weighted average of 5.4%, a difference of 12.0%.
Female Unemployment Correlation Summary
| Measurement | Trinidadian and Tobagonian | Peruvian |
| Minimum | 1.8% | 2.6% |
| Maximum | 33.3% | 27.5% |
| Range | 31.5% | 24.9% |
| Mean | 6.8% | 6.8% |
| Median | 6.0% | 5.6% |
| Interquartile 25% (IQ1) | 5.1% | 4.9% |
| Interquartile 75% (IQ3) | 7.3% | 7.0% |
| Interquartile Range (IQR) | 2.2% | 2.1% |
| Standard Deviation (Sample) | 4.4% | 3.7% |
| Standard Deviation (Population) | 4.4% | 3.7% |
Similar Demographics by Female Unemployment
Demographics Similar to Trinidadians and Tobagonians by Female Unemployment
In terms of female unemployment, the demographic groups most similar to Trinidadians and Tobagonians are Haitian (6.1%, a difference of 0.010%), Immigrants from Guatemala (6.1%, a difference of 0.050%), Immigrants from Caribbean (6.1%, a difference of 0.060%), Chippewa (6.1%, a difference of 0.080%), and Immigrants from Cabo Verde (6.1%, a difference of 0.11%).
| Demographics | Rating | Rank | Female Unemployment |
| Colville | 0.0 /100 | #282 | Tragic 6.0% |
| Salvadorans | 0.0 /100 | #283 | Tragic 6.0% |
| Immigrants | Senegal | 0.0 /100 | #284 | Tragic 6.1% |
| Immigrants | Cabo Verde | 0.0 /100 | #285 | Tragic 6.1% |
| Chippewa | 0.0 /100 | #286 | Tragic 6.1% |
| Immigrants | Guatemala | 0.0 /100 | #287 | Tragic 6.1% |
| Haitians | 0.0 /100 | #288 | Tragic 6.1% |
| Trinidadians and Tobagonians | 0.0 /100 | #289 | Tragic 6.1% |
| Immigrants | Caribbean | 0.0 /100 | #290 | Tragic 6.1% |
| Immigrants | West Indies | 0.0 /100 | #291 | Tragic 6.1% |
| Immigrants | Trinidad and Tobago | 0.0 /100 | #292 | Tragic 6.1% |
| Mexicans | 0.0 /100 | #293 | Tragic 6.1% |
| Immigrants | El Salvador | 0.0 /100 | #294 | Tragic 6.1% |
| Immigrants | Latin America | 0.0 /100 | #295 | Tragic 6.1% |
| Alaskan Athabascans | 0.0 /100 | #296 | Tragic 6.1% |
Demographics Similar to Peruvians by Female Unemployment
In terms of female unemployment, the demographic groups most similar to Peruvians are Comanche (5.4%, a difference of 0.070%), Immigrants from Nicaragua (5.4%, a difference of 0.10%), Bermudan (5.4%, a difference of 0.10%), Seminole (5.4%, a difference of 0.12%), and Samoan (5.4%, a difference of 0.17%).
| Demographics | Rating | Rank | Female Unemployment |
| Choctaw | 12.3 /100 | #210 | Poor 5.4% |
| Ottawa | 11.6 /100 | #211 | Poor 5.4% |
| Uruguayans | 11.4 /100 | #212 | Poor 5.4% |
| Samoans | 10.6 /100 | #213 | Poor 5.4% |
| Seminole | 10.3 /100 | #214 | Poor 5.4% |
| Immigrants | Nicaragua | 10.2 /100 | #215 | Poor 5.4% |
| Comanche | 10.0 /100 | #216 | Poor 5.4% |
| Peruvians | 9.6 /100 | #217 | Tragic 5.4% |
| Bermudans | 9.0 /100 | #218 | Tragic 5.4% |
| South Americans | 8.6 /100 | #219 | Tragic 5.4% |
| Immigrants | Africa | 8.5 /100 | #220 | Tragic 5.4% |
| Brazilians | 7.3 /100 | #221 | Tragic 5.5% |
| Nicaraguans | 7.2 /100 | #222 | Tragic 5.5% |
| Delaware | 7.2 /100 | #223 | Tragic 5.5% |
| Iraqis | 7.1 /100 | #224 | Tragic 5.5% |