Trinidadian and Tobagonian vs Peruvian 1st Grade
COMPARE
Trinidadian and Tobagonian
Peruvian
1st Grade
1st Grade Comparison
Trinidadians and Tobagonians
Peruvians
97.3%
1ST GRADE
0.1/ 100
METRIC RATING
281st/ 347
METRIC RANK
97.6%
1ST GRADE
1.0/ 100
METRIC RATING
247th/ 347
METRIC RANK
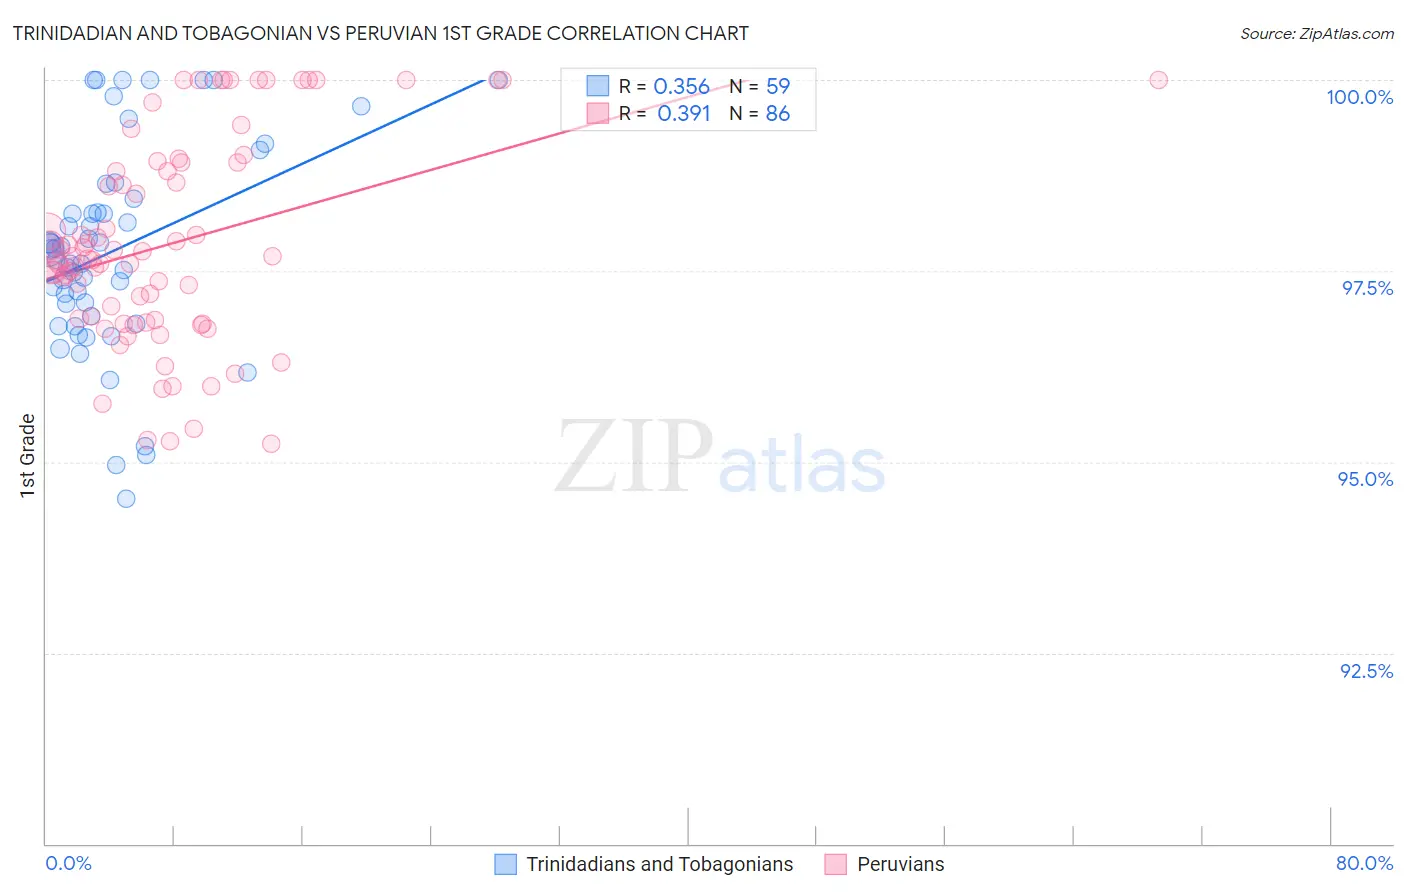
Trinidadian and Tobagonian vs Peruvian 1st Grade Correlation Chart
The statistical analysis conducted on geographies consisting of 219,882,819 people shows a mild positive correlation between the proportion of Trinidadians and Tobagonians and percentage of population with at least 1st grade education in the United States with a correlation coefficient (R) of 0.356 and weighted average of 97.3%. Similarly, the statistical analysis conducted on geographies consisting of 363,068,462 people shows a mild positive correlation between the proportion of Peruvians and percentage of population with at least 1st grade education in the United States with a correlation coefficient (R) of 0.391 and weighted average of 97.6%, a difference of 0.23%.
1st Grade Correlation Summary
| Measurement | Trinidadian and Tobagonian | Peruvian |
| Minimum | 94.5% | 95.2% |
| Maximum | 100.0% | 100.0% |
| Range | 5.5% | 4.8% |
| Mean | 97.8% | 97.9% |
| Median | 97.8% | 97.7% |
| Interquartile 25% (IQ1) | 96.9% | 96.9% |
| Interquartile 75% (IQ3) | 98.4% | 98.9% |
| Interquartile Range (IQR) | 1.5% | 2.1% |
| Standard Deviation (Sample) | 1.3% | 1.3% |
| Standard Deviation (Population) | 1.3% | 1.3% |
Similar Demographics by 1st Grade
Demographics Similar to Trinidadians and Tobagonians by 1st Grade
In terms of 1st grade, the demographic groups most similar to Trinidadians and Tobagonians are Afghan (97.4%, a difference of 0.0%), Barbadian (97.3%, a difference of 0.0%), Immigrants from Uzbekistan (97.4%, a difference of 0.010%), Immigrants from Ghana (97.4%, a difference of 0.010%), and Immigrants from Western Africa (97.4%, a difference of 0.030%).
| Demographics | Rating | Rank | 1st Grade |
| Ghanaians | 0.1 /100 | #274 | Tragic 97.4% |
| Immigrants | China | 0.1 /100 | #275 | Tragic 97.4% |
| Immigrants | Philippines | 0.1 /100 | #276 | Tragic 97.4% |
| Immigrants | Western Africa | 0.1 /100 | #277 | Tragic 97.4% |
| Immigrants | Uzbekistan | 0.1 /100 | #278 | Tragic 97.4% |
| Immigrants | Ghana | 0.1 /100 | #279 | Tragic 97.4% |
| Afghans | 0.1 /100 | #280 | Tragic 97.4% |
| Trinidadians and Tobagonians | 0.1 /100 | #281 | Tragic 97.3% |
| Barbadians | 0.1 /100 | #282 | Tragic 97.3% |
| Immigrants | West Indies | 0.0 /100 | #283 | Tragic 97.3% |
| Immigrants | Trinidad and Tobago | 0.0 /100 | #284 | Tragic 97.3% |
| Immigrants | Portugal | 0.0 /100 | #285 | Tragic 97.3% |
| Immigrants | Barbados | 0.0 /100 | #286 | Tragic 97.3% |
| Immigrants | Hong Kong | 0.0 /100 | #287 | Tragic 97.3% |
| Immigrants | Thailand | 0.0 /100 | #288 | Tragic 97.3% |
Demographics Similar to Peruvians by 1st Grade
In terms of 1st grade, the demographic groups most similar to Peruvians are South American (97.6%, a difference of 0.0%), Immigrants from Eastern Africa (97.6%, a difference of 0.0%), Immigrants from Middle Africa (97.6%, a difference of 0.0%), Immigrants from Senegal (97.6%, a difference of 0.0%), and Bolivian (97.6%, a difference of 0.010%).
| Demographics | Rating | Rank | 1st Grade |
| Koreans | 1.5 /100 | #240 | Tragic 97.6% |
| Liberians | 1.4 /100 | #241 | Tragic 97.6% |
| Immigrants | Indonesia | 1.2 /100 | #242 | Tragic 97.6% |
| Bolivians | 1.2 /100 | #243 | Tragic 97.6% |
| Asians | 1.1 /100 | #244 | Tragic 97.6% |
| South Americans | 1.1 /100 | #245 | Tragic 97.6% |
| Immigrants | Eastern Africa | 1.0 /100 | #246 | Tragic 97.6% |
| Peruvians | 1.0 /100 | #247 | Tragic 97.6% |
| Immigrants | Middle Africa | 1.0 /100 | #248 | Tragic 97.6% |
| Immigrants | Senegal | 1.0 /100 | #249 | Tragic 97.6% |
| Ethiopians | 0.9 /100 | #250 | Tragic 97.6% |
| Immigrants | Iraq | 0.9 /100 | #251 | Tragic 97.6% |
| Immigrants | Africa | 0.9 /100 | #252 | Tragic 97.6% |
| Immigrants | Congo | 0.7 /100 | #253 | Tragic 97.5% |
| Immigrants | Asia | 0.7 /100 | #254 | Tragic 97.5% |