Trinidadian and Tobagonian vs Immigrants from Mexico 11th Grade
COMPARE
Trinidadian and Tobagonian
Immigrants from Mexico
11th Grade
11th Grade Comparison
Trinidadians and Tobagonians
Immigrants from Mexico
91.1%
11TH GRADE
0.2/ 100
METRIC RATING
270th/ 347
METRIC RANK
84.5%
11TH GRADE
0.0/ 100
METRIC RATING
347th/ 347
METRIC RANK
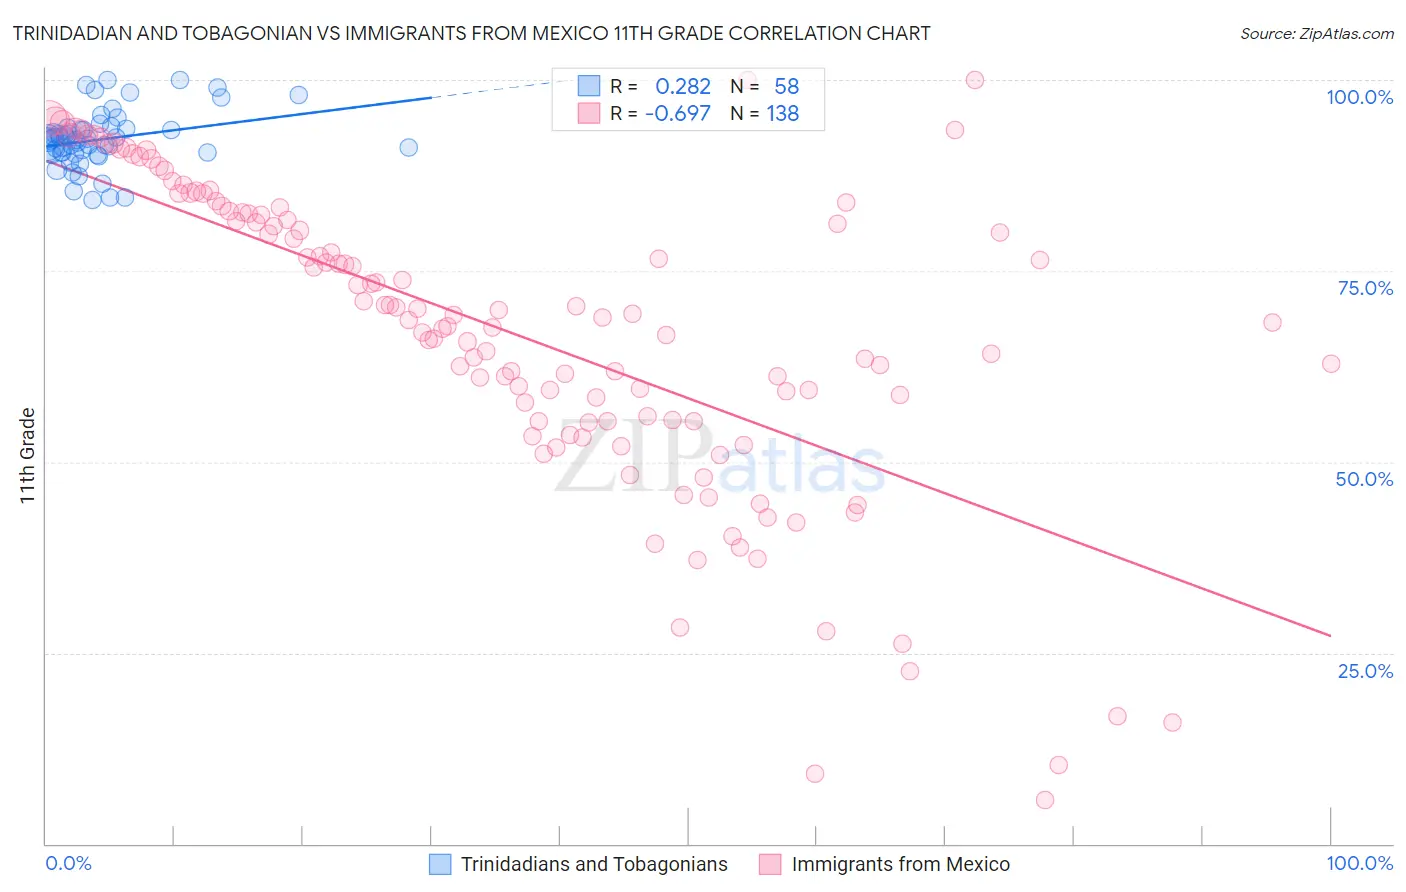
Trinidadian and Tobagonian vs Immigrants from Mexico 11th Grade Correlation Chart
The statistical analysis conducted on geographies consisting of 219,881,170 people shows a weak positive correlation between the proportion of Trinidadians and Tobagonians and percentage of population with at least 11th grade education in the United States with a correlation coefficient (R) of 0.282 and weighted average of 91.1%. Similarly, the statistical analysis conducted on geographies consisting of 513,766,645 people shows a significant negative correlation between the proportion of Immigrants from Mexico and percentage of population with at least 11th grade education in the United States with a correlation coefficient (R) of -0.697 and weighted average of 84.5%, a difference of 7.8%.
11th Grade Correlation Summary
| Measurement | Trinidadian and Tobagonian | Immigrants from Mexico |
| Minimum | 84.2% | 5.7% |
| Maximum | 100.0% | 100.0% |
| Range | 15.8% | 94.3% |
| Mean | 92.2% | 67.1% |
| Median | 92.2% | 69.1% |
| Interquartile 25% (IQ1) | 90.5% | 55.4% |
| Interquartile 75% (IQ3) | 93.7% | 82.6% |
| Interquartile Range (IQR) | 3.2% | 27.3% |
| Standard Deviation (Sample) | 3.7% | 20.2% |
| Standard Deviation (Population) | 3.7% | 20.1% |
Similar Demographics by 11th Grade
Demographics Similar to Trinidadians and Tobagonians by 11th Grade
In terms of 11th grade, the demographic groups most similar to Trinidadians and Tobagonians are Ute (91.1%, a difference of 0.030%), Immigrants from Peru (91.0%, a difference of 0.030%), West Indian (91.0%, a difference of 0.040%), U.S. Virgin Islander (91.1%, a difference of 0.060%), and Paiute (91.0%, a difference of 0.080%).
| Demographics | Rating | Rank | 11th Grade |
| Immigrants | Ghana | 0.3 /100 | #263 | Tragic 91.2% |
| Yup'ik | 0.3 /100 | #264 | Tragic 91.2% |
| Pueblo | 0.3 /100 | #265 | Tragic 91.2% |
| Immigrants | Western Africa | 0.3 /100 | #266 | Tragic 91.2% |
| Immigrants | Jamaica | 0.3 /100 | #267 | Tragic 91.2% |
| U.S. Virgin Islanders | 0.2 /100 | #268 | Tragic 91.1% |
| Ute | 0.2 /100 | #269 | Tragic 91.1% |
| Trinidadians and Tobagonians | 0.2 /100 | #270 | Tragic 91.1% |
| Immigrants | Peru | 0.1 /100 | #271 | Tragic 91.0% |
| West Indians | 0.1 /100 | #272 | Tragic 91.0% |
| Paiute | 0.1 /100 | #273 | Tragic 91.0% |
| Immigrants | Trinidad and Tobago | 0.1 /100 | #274 | Tragic 90.9% |
| Immigrants | South Eastern Asia | 0.1 /100 | #275 | Tragic 90.9% |
| Bangladeshis | 0.1 /100 | #276 | Tragic 90.9% |
| Immigrants | Congo | 0.1 /100 | #277 | Tragic 90.9% |
Demographics Similar to Immigrants from Mexico by 11th Grade
In terms of 11th grade, the demographic groups most similar to Immigrants from Mexico are Spanish American Indian (84.7%, a difference of 0.30%), Immigrants from Central America (84.9%, a difference of 0.54%), Yakama (85.0%, a difference of 0.57%), Immigrants from El Salvador (85.3%, a difference of 0.98%), and Immigrants from Guatemala (85.8%, a difference of 1.6%).
| Demographics | Rating | Rank | 11th Grade |
| Immigrants | Yemen | 0.0 /100 | #333 | Tragic 87.1% |
| Houma | 0.0 /100 | #334 | Tragic 87.0% |
| Central Americans | 0.0 /100 | #335 | Tragic 86.9% |
| Immigrants | Dominican Republic | 0.0 /100 | #336 | Tragic 86.9% |
| Immigrants | Honduras | 0.0 /100 | #337 | Tragic 86.9% |
| Immigrants | Latin America | 0.0 /100 | #338 | Tragic 86.8% |
| Guatemalans | 0.0 /100 | #339 | Tragic 86.4% |
| Salvadorans | 0.0 /100 | #340 | Tragic 86.2% |
| Mexicans | 0.0 /100 | #341 | Tragic 86.1% |
| Immigrants | Guatemala | 0.0 /100 | #342 | Tragic 85.8% |
| Immigrants | El Salvador | 0.0 /100 | #343 | Tragic 85.3% |
| Yakama | 0.0 /100 | #344 | Tragic 85.0% |
| Immigrants | Central America | 0.0 /100 | #345 | Tragic 84.9% |
| Spanish American Indians | 0.0 /100 | #346 | Tragic 84.7% |
| Immigrants | Mexico | 0.0 /100 | #347 | Tragic 84.5% |