Tongan vs Immigrants from Scotland Professional Degree
COMPARE
Tongan
Immigrants from Scotland
Professional Degree
Professional Degree Comparison
Tongans
Immigrants from Scotland
3.7%
PROFESSIONAL DEGREE
1.3/ 100
METRIC RATING
254th/ 347
METRIC RANK
5.3%
PROFESSIONAL DEGREE
99.5/ 100
METRIC RATING
90th/ 347
METRIC RANK
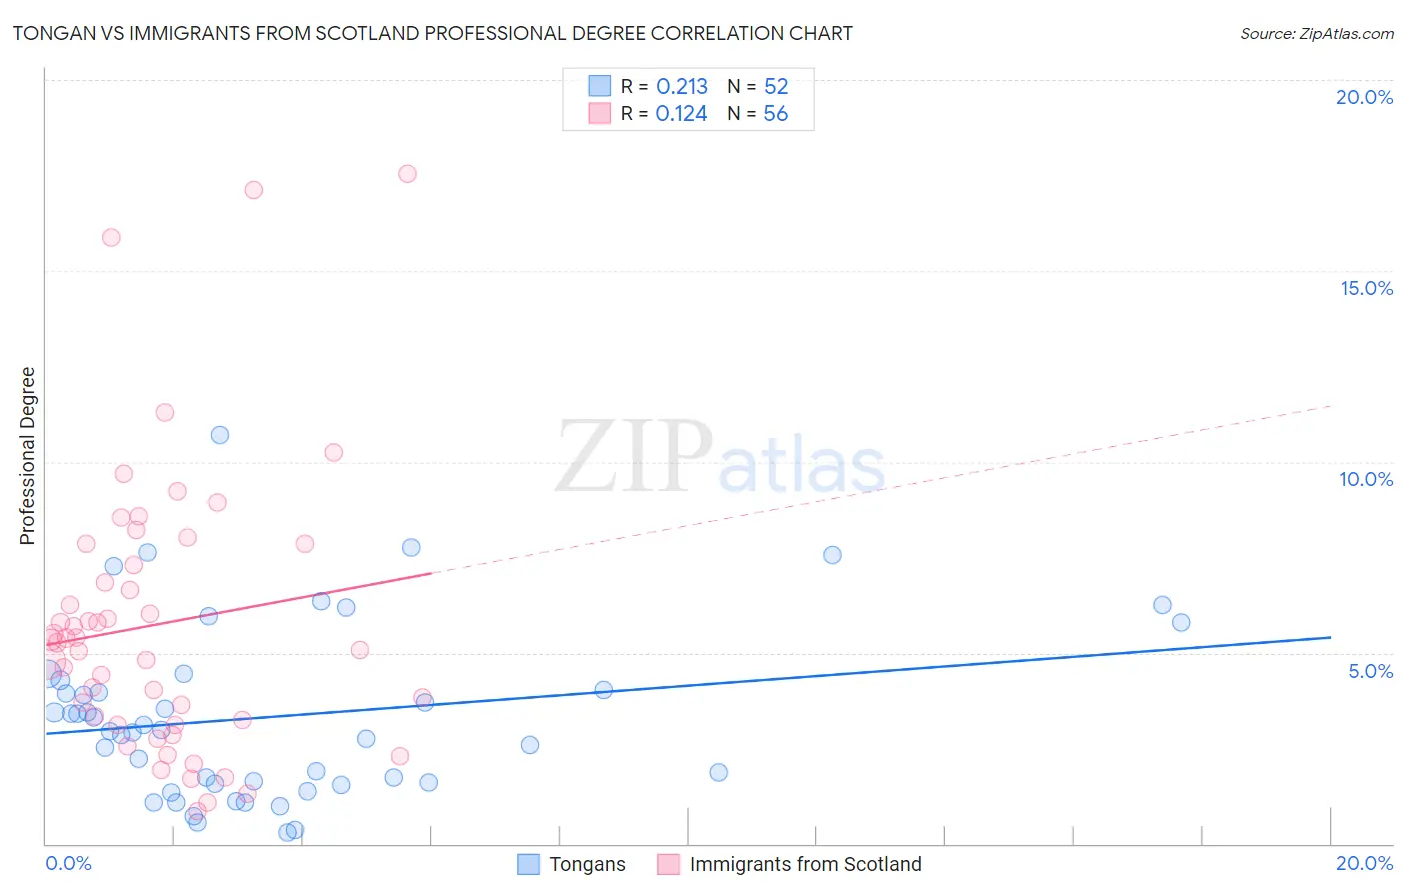
Tongan vs Immigrants from Scotland Professional Degree Correlation Chart
The statistical analysis conducted on geographies consisting of 102,718,733 people shows a weak positive correlation between the proportion of Tongans and percentage of population with at least professional degree education in the United States with a correlation coefficient (R) of 0.213 and weighted average of 3.7%. Similarly, the statistical analysis conducted on geographies consisting of 196,234,125 people shows a poor positive correlation between the proportion of Immigrants from Scotland and percentage of population with at least professional degree education in the United States with a correlation coefficient (R) of 0.124 and weighted average of 5.3%, a difference of 41.4%.
Professional Degree Correlation Summary
| Measurement | Tongan | Immigrants from Scotland |
| Minimum | 0.30% | 0.84% |
| Maximum | 10.7% | 17.6% |
| Range | 10.4% | 16.7% |
| Mean | 3.3% | 5.8% |
| Median | 3.0% | 5.3% |
| Interquartile 25% (IQ1) | 1.6% | 3.2% |
| Interquartile 75% (IQ3) | 4.2% | 7.6% |
| Interquartile Range (IQR) | 2.6% | 4.4% |
| Standard Deviation (Sample) | 2.3% | 3.6% |
| Standard Deviation (Population) | 2.2% | 3.6% |
Similar Demographics by Professional Degree
Demographics Similar to Tongans by Professional Degree
In terms of professional degree, the demographic groups most similar to Tongans are Pueblo (3.7%, a difference of 0.14%), Jamaican (3.7%, a difference of 0.24%), Immigrants from Nicaragua (3.7%, a difference of 0.39%), Osage (3.7%, a difference of 0.43%), and Iroquois (3.7%, a difference of 0.53%).
| Demographics | Rating | Rank | Professional Degree |
| Guyanese | 1.6 /100 | #247 | Tragic 3.8% |
| Hmong | 1.6 /100 | #248 | Tragic 3.7% |
| Immigrants | Grenada | 1.5 /100 | #249 | Tragic 3.7% |
| Immigrants | Fiji | 1.5 /100 | #250 | Tragic 3.7% |
| Immigrants | Nicaragua | 1.4 /100 | #251 | Tragic 3.7% |
| Jamaicans | 1.4 /100 | #252 | Tragic 3.7% |
| Pueblo | 1.4 /100 | #253 | Tragic 3.7% |
| Tongans | 1.3 /100 | #254 | Tragic 3.7% |
| Osage | 1.2 /100 | #255 | Tragic 3.7% |
| Iroquois | 1.2 /100 | #256 | Tragic 3.7% |
| Bahamians | 1.1 /100 | #257 | Tragic 3.7% |
| Immigrants | St. Vincent and the Grenadines | 1.1 /100 | #258 | Tragic 3.7% |
| Africans | 1.0 /100 | #259 | Tragic 3.7% |
| Indonesians | 1.0 /100 | #260 | Tragic 3.7% |
| Immigrants | Guyana | 1.0 /100 | #261 | Tragic 3.7% |
Demographics Similar to Immigrants from Scotland by Professional Degree
In terms of professional degree, the demographic groups most similar to Immigrants from Scotland are Egyptian (5.3%, a difference of 0.10%), Chilean (5.3%, a difference of 0.10%), Laotian (5.2%, a difference of 0.16%), Immigrants from Eastern Europe (5.2%, a difference of 0.20%), and Immigrants from Chile (5.3%, a difference of 0.24%).
| Demographics | Rating | Rank | Professional Degree |
| Carpatho Rusyns | 99.6 /100 | #83 | Exceptional 5.3% |
| Immigrants | Croatia | 99.6 /100 | #84 | Exceptional 5.3% |
| Immigrants | Zimbabwe | 99.6 /100 | #85 | Exceptional 5.3% |
| Greeks | 99.6 /100 | #86 | Exceptional 5.3% |
| Immigrants | Chile | 99.5 /100 | #87 | Exceptional 5.3% |
| Egyptians | 99.5 /100 | #88 | Exceptional 5.3% |
| Chileans | 99.5 /100 | #89 | Exceptional 5.3% |
| Immigrants | Scotland | 99.5 /100 | #90 | Exceptional 5.3% |
| Laotians | 99.5 /100 | #91 | Exceptional 5.2% |
| Immigrants | Eastern Europe | 99.5 /100 | #92 | Exceptional 5.2% |
| Northern Europeans | 99.3 /100 | #93 | Exceptional 5.2% |
| Alsatians | 99.3 /100 | #94 | Exceptional 5.2% |
| Zimbabweans | 99.3 /100 | #95 | Exceptional 5.2% |
| Immigrants | Uzbekistan | 99.2 /100 | #96 | Exceptional 5.2% |
| Syrians | 99.1 /100 | #97 | Exceptional 5.2% |