Arab vs Immigrants from Scotland Professional Degree
COMPARE
Arab
Immigrants from Scotland
Professional Degree
Professional Degree Comparison
Arabs
Immigrants from Scotland
5.0%
PROFESSIONAL DEGREE
98.2/ 100
METRIC RATING
104th/ 347
METRIC RANK
5.3%
PROFESSIONAL DEGREE
99.5/ 100
METRIC RATING
90th/ 347
METRIC RANK
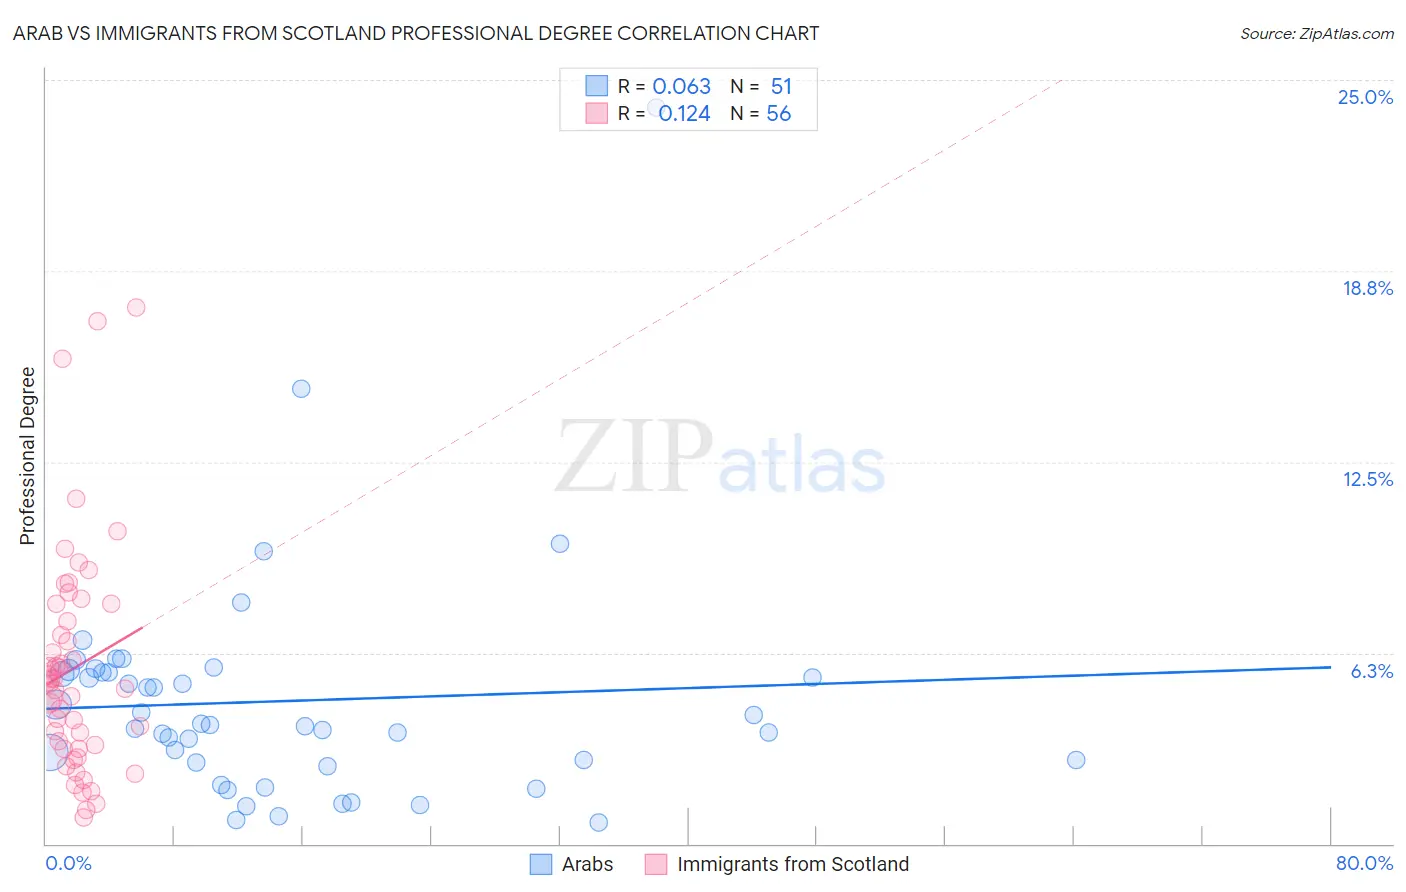
Arab vs Immigrants from Scotland Professional Degree Correlation Chart
The statistical analysis conducted on geographies consisting of 485,125,544 people shows a slight positive correlation between the proportion of Arabs and percentage of population with at least professional degree education in the United States with a correlation coefficient (R) of 0.063 and weighted average of 5.0%. Similarly, the statistical analysis conducted on geographies consisting of 196,234,125 people shows a poor positive correlation between the proportion of Immigrants from Scotland and percentage of population with at least professional degree education in the United States with a correlation coefficient (R) of 0.124 and weighted average of 5.3%, a difference of 4.1%.
Professional Degree Correlation Summary
| Measurement | Arab | Immigrants from Scotland |
| Minimum | 0.70% | 0.84% |
| Maximum | 24.1% | 17.6% |
| Range | 23.4% | 16.7% |
| Mean | 4.7% | 5.8% |
| Median | 3.9% | 5.3% |
| Interquartile 25% (IQ1) | 2.6% | 3.2% |
| Interquartile 75% (IQ3) | 5.6% | 7.6% |
| Interquartile Range (IQR) | 3.0% | 4.4% |
| Standard Deviation (Sample) | 3.8% | 3.6% |
| Standard Deviation (Population) | 3.7% | 3.6% |
Demographics Similar to Arabs and Immigrants from Scotland by Professional Degree
In terms of professional degree, the demographic groups most similar to Arabs are Immigrants from Uganda (5.0%, a difference of 0.020%), Immigrants from Ukraine (5.0%, a difference of 0.050%), Maltese (5.0%, a difference of 0.17%), Immigrants from Northern Africa (5.1%, a difference of 0.31%), and Ukrainian (5.1%, a difference of 0.56%). Similarly, the demographic groups most similar to Immigrants from Scotland are Egyptian (5.3%, a difference of 0.10%), Chilean (5.3%, a difference of 0.10%), Laotian (5.2%, a difference of 0.16%), Immigrants from Eastern Europe (5.2%, a difference of 0.20%), and Immigrants from Chile (5.3%, a difference of 0.24%).
| Demographics | Rating | Rank | Professional Degree |
| Immigrants | Chile | 99.5 /100 | #87 | Exceptional 5.3% |
| Egyptians | 99.5 /100 | #88 | Exceptional 5.3% |
| Chileans | 99.5 /100 | #89 | Exceptional 5.3% |
| Immigrants | Scotland | 99.5 /100 | #90 | Exceptional 5.3% |
| Laotians | 99.5 /100 | #91 | Exceptional 5.2% |
| Immigrants | Eastern Europe | 99.5 /100 | #92 | Exceptional 5.2% |
| Northern Europeans | 99.3 /100 | #93 | Exceptional 5.2% |
| Alsatians | 99.3 /100 | #94 | Exceptional 5.2% |
| Zimbabweans | 99.3 /100 | #95 | Exceptional 5.2% |
| Immigrants | Uzbekistan | 99.2 /100 | #96 | Exceptional 5.2% |
| Syrians | 99.1 /100 | #97 | Exceptional 5.2% |
| Austrians | 99.1 /100 | #98 | Exceptional 5.2% |
| Immigrants | Italy | 99.1 /100 | #99 | Exceptional 5.2% |
| Ugandans | 98.8 /100 | #100 | Exceptional 5.1% |
| Immigrants | Egypt | 98.5 /100 | #101 | Exceptional 5.1% |
| Ukrainians | 98.5 /100 | #102 | Exceptional 5.1% |
| Immigrants | Northern Africa | 98.4 /100 | #103 | Exceptional 5.1% |
| Arabs | 98.2 /100 | #104 | Exceptional 5.0% |
| Immigrants | Uganda | 98.2 /100 | #105 | Exceptional 5.0% |
| Immigrants | Ukraine | 98.2 /100 | #106 | Exceptional 5.0% |
| Maltese | 98.1 /100 | #107 | Exceptional 5.0% |