Tongan vs Immigrants from Jordan Professional Degree
COMPARE
Tongan
Immigrants from Jordan
Professional Degree
Professional Degree Comparison
Tongans
Immigrants from Jordan
3.7%
PROFESSIONAL DEGREE
1.3/ 100
METRIC RATING
254th/ 347
METRIC RANK
4.7%
PROFESSIONAL DEGREE
89.0/ 100
METRIC RATING
136th/ 347
METRIC RANK
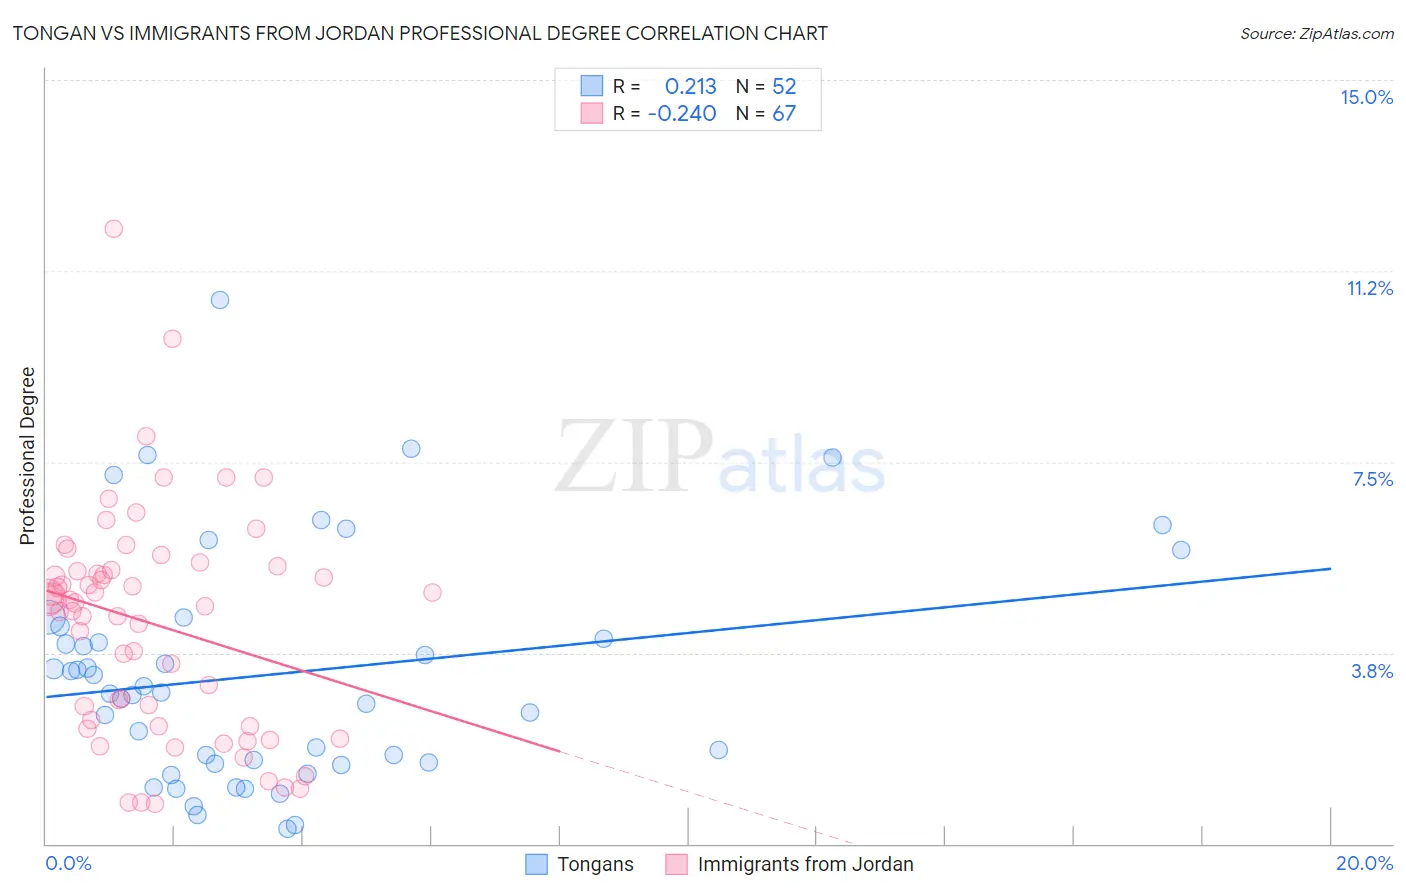
Tongan vs Immigrants from Jordan Professional Degree Correlation Chart
The statistical analysis conducted on geographies consisting of 102,718,733 people shows a weak positive correlation between the proportion of Tongans and percentage of population with at least professional degree education in the United States with a correlation coefficient (R) of 0.213 and weighted average of 3.7%. Similarly, the statistical analysis conducted on geographies consisting of 181,207,103 people shows a weak negative correlation between the proportion of Immigrants from Jordan and percentage of population with at least professional degree education in the United States with a correlation coefficient (R) of -0.240 and weighted average of 4.7%, a difference of 27.6%.
Professional Degree Correlation Summary
| Measurement | Tongan | Immigrants from Jordan |
| Minimum | 0.30% | 0.78% |
| Maximum | 10.7% | 12.1% |
| Range | 10.4% | 11.3% |
| Mean | 3.3% | 4.3% |
| Median | 3.0% | 4.7% |
| Interquartile 25% (IQ1) | 1.6% | 2.3% |
| Interquartile 75% (IQ3) | 4.2% | 5.4% |
| Interquartile Range (IQR) | 2.6% | 3.1% |
| Standard Deviation (Sample) | 2.3% | 2.2% |
| Standard Deviation (Population) | 2.2% | 2.2% |
Similar Demographics by Professional Degree
Demographics Similar to Tongans by Professional Degree
In terms of professional degree, the demographic groups most similar to Tongans are Pueblo (3.7%, a difference of 0.14%), Jamaican (3.7%, a difference of 0.24%), Immigrants from Nicaragua (3.7%, a difference of 0.39%), Osage (3.7%, a difference of 0.43%), and Iroquois (3.7%, a difference of 0.53%).
| Demographics | Rating | Rank | Professional Degree |
| Guyanese | 1.6 /100 | #247 | Tragic 3.8% |
| Hmong | 1.6 /100 | #248 | Tragic 3.7% |
| Immigrants | Grenada | 1.5 /100 | #249 | Tragic 3.7% |
| Immigrants | Fiji | 1.5 /100 | #250 | Tragic 3.7% |
| Immigrants | Nicaragua | 1.4 /100 | #251 | Tragic 3.7% |
| Jamaicans | 1.4 /100 | #252 | Tragic 3.7% |
| Pueblo | 1.4 /100 | #253 | Tragic 3.7% |
| Tongans | 1.3 /100 | #254 | Tragic 3.7% |
| Osage | 1.2 /100 | #255 | Tragic 3.7% |
| Iroquois | 1.2 /100 | #256 | Tragic 3.7% |
| Bahamians | 1.1 /100 | #257 | Tragic 3.7% |
| Immigrants | St. Vincent and the Grenadines | 1.1 /100 | #258 | Tragic 3.7% |
| Africans | 1.0 /100 | #259 | Tragic 3.7% |
| Indonesians | 1.0 /100 | #260 | Tragic 3.7% |
| Immigrants | Guyana | 1.0 /100 | #261 | Tragic 3.7% |
Demographics Similar to Immigrants from Jordan by Professional Degree
In terms of professional degree, the demographic groups most similar to Immigrants from Jordan are Jordanian (4.7%, a difference of 0.020%), Afghan (4.7%, a difference of 0.060%), Macedonian (4.8%, a difference of 0.28%), South American Indian (4.8%, a difference of 0.31%), and Italian (4.8%, a difference of 0.44%).
| Demographics | Rating | Rank | Professional Degree |
| Palestinians | 91.5 /100 | #129 | Exceptional 4.8% |
| Icelanders | 91.5 /100 | #130 | Exceptional 4.8% |
| Immigrants | Nepal | 91.4 /100 | #131 | Exceptional 4.8% |
| Pakistanis | 90.9 /100 | #132 | Exceptional 4.8% |
| Italians | 90.2 /100 | #133 | Exceptional 4.8% |
| South American Indians | 89.9 /100 | #134 | Excellent 4.8% |
| Macedonians | 89.8 /100 | #135 | Excellent 4.8% |
| Immigrants | Jordan | 89.0 /100 | #136 | Excellent 4.7% |
| Jordanians | 88.9 /100 | #137 | Excellent 4.7% |
| Afghans | 88.8 /100 | #138 | Excellent 4.7% |
| South Americans | 85.6 /100 | #139 | Excellent 4.7% |
| Canadians | 84.4 /100 | #140 | Excellent 4.7% |
| Basques | 81.8 /100 | #141 | Excellent 4.6% |
| Sudanese | 81.3 /100 | #142 | Excellent 4.6% |
| Hungarians | 80.8 /100 | #143 | Excellent 4.6% |