Carpatho Rusyn vs Immigrants from Scotland Professional Degree
COMPARE
Carpatho Rusyn
Immigrants from Scotland
Professional Degree
Professional Degree Comparison
Carpatho Rusyns
Immigrants from Scotland
5.3%
PROFESSIONAL DEGREE
99.6/ 100
METRIC RATING
83rd/ 347
METRIC RANK
5.3%
PROFESSIONAL DEGREE
99.5/ 100
METRIC RATING
90th/ 347
METRIC RANK
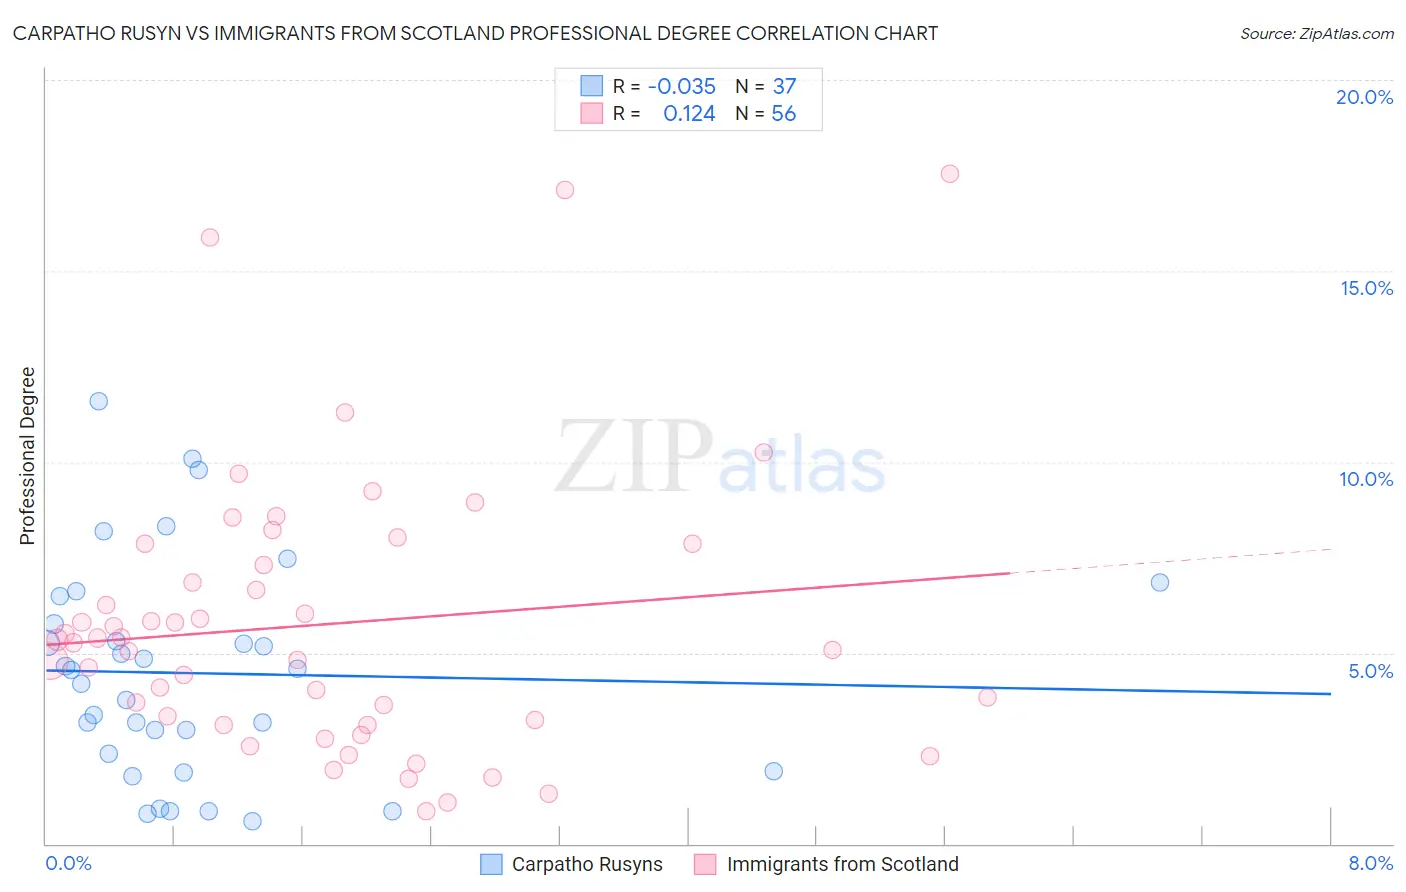
Carpatho Rusyn vs Immigrants from Scotland Professional Degree Correlation Chart
The statistical analysis conducted on geographies consisting of 58,844,237 people shows no correlation between the proportion of Carpatho Rusyns and percentage of population with at least professional degree education in the United States with a correlation coefficient (R) of -0.035 and weighted average of 5.3%. Similarly, the statistical analysis conducted on geographies consisting of 196,234,125 people shows a poor positive correlation between the proportion of Immigrants from Scotland and percentage of population with at least professional degree education in the United States with a correlation coefficient (R) of 0.124 and weighted average of 5.3%, a difference of 0.37%.
Professional Degree Correlation Summary
| Measurement | Carpatho Rusyn | Immigrants from Scotland |
| Minimum | 0.59% | 0.84% |
| Maximum | 11.6% | 17.6% |
| Range | 11.0% | 16.7% |
| Mean | 4.5% | 5.8% |
| Median | 4.6% | 5.3% |
| Interquartile 25% (IQ1) | 2.1% | 3.2% |
| Interquartile 75% (IQ3) | 6.1% | 7.6% |
| Interquartile Range (IQR) | 4.0% | 4.4% |
| Standard Deviation (Sample) | 2.8% | 3.6% |
| Standard Deviation (Population) | 2.8% | 3.6% |
Demographics Similar to Carpatho Rusyns and Immigrants from Scotland by Professional Degree
In terms of professional degree, the demographic groups most similar to Carpatho Rusyns are Immigrants from Croatia (5.3%, a difference of 0.0%), Immigrants from Zimbabwe (5.3%, a difference of 0.020%), Greek (5.3%, a difference of 0.020%), Immigrants from Chile (5.3%, a difference of 0.13%), and Romanian (5.3%, a difference of 0.20%). Similarly, the demographic groups most similar to Immigrants from Scotland are Egyptian (5.3%, a difference of 0.10%), Chilean (5.3%, a difference of 0.10%), Laotian (5.2%, a difference of 0.16%), Immigrants from Eastern Europe (5.2%, a difference of 0.20%), and Immigrants from Chile (5.3%, a difference of 0.24%).
| Demographics | Rating | Rank | Professional Degree |
| Immigrants | Canada | 99.7 /100 | #76 | Exceptional 5.3% |
| Immigrants | Ethiopia | 99.7 /100 | #77 | Exceptional 5.3% |
| Armenians | 99.7 /100 | #78 | Exceptional 5.3% |
| Immigrants | North America | 99.7 /100 | #79 | Exceptional 5.3% |
| Immigrants | England | 99.6 /100 | #80 | Exceptional 5.3% |
| Immigrants | Brazil | 99.6 /100 | #81 | Exceptional 5.3% |
| Romanians | 99.6 /100 | #82 | Exceptional 5.3% |
| Carpatho Rusyns | 99.6 /100 | #83 | Exceptional 5.3% |
| Immigrants | Croatia | 99.6 /100 | #84 | Exceptional 5.3% |
| Immigrants | Zimbabwe | 99.6 /100 | #85 | Exceptional 5.3% |
| Greeks | 99.6 /100 | #86 | Exceptional 5.3% |
| Immigrants | Chile | 99.5 /100 | #87 | Exceptional 5.3% |
| Egyptians | 99.5 /100 | #88 | Exceptional 5.3% |
| Chileans | 99.5 /100 | #89 | Exceptional 5.3% |
| Immigrants | Scotland | 99.5 /100 | #90 | Exceptional 5.3% |
| Laotians | 99.5 /100 | #91 | Exceptional 5.2% |
| Immigrants | Eastern Europe | 99.5 /100 | #92 | Exceptional 5.2% |
| Northern Europeans | 99.3 /100 | #93 | Exceptional 5.2% |
| Alsatians | 99.3 /100 | #94 | Exceptional 5.2% |
| Zimbabweans | 99.3 /100 | #95 | Exceptional 5.2% |
| Immigrants | Uzbekistan | 99.2 /100 | #96 | Exceptional 5.2% |