Crow vs Immigrants from Scotland Professional Degree
COMPARE
Crow
Immigrants from Scotland
Professional Degree
Professional Degree Comparison
Crow
Immigrants from Scotland
3.2%
PROFESSIONAL DEGREE
0.0/ 100
METRIC RATING
324th/ 347
METRIC RANK
5.3%
PROFESSIONAL DEGREE
99.5/ 100
METRIC RATING
90th/ 347
METRIC RANK
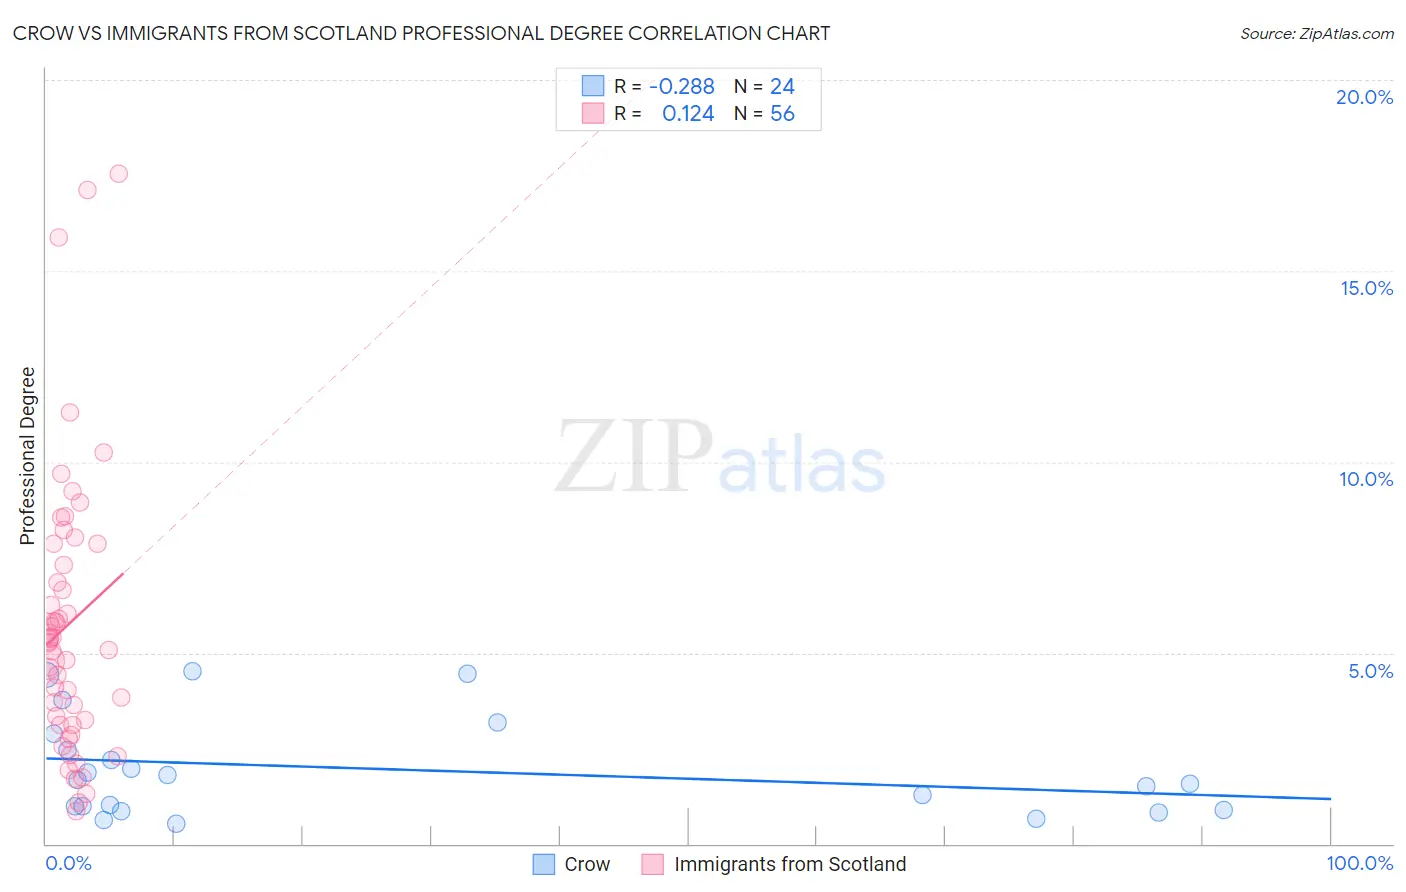
Crow vs Immigrants from Scotland Professional Degree Correlation Chart
The statistical analysis conducted on geographies consisting of 59,107,625 people shows a weak negative correlation between the proportion of Crow and percentage of population with at least professional degree education in the United States with a correlation coefficient (R) of -0.288 and weighted average of 3.2%. Similarly, the statistical analysis conducted on geographies consisting of 196,234,125 people shows a poor positive correlation between the proportion of Immigrants from Scotland and percentage of population with at least professional degree education in the United States with a correlation coefficient (R) of 0.124 and weighted average of 5.3%, a difference of 66.3%.
Professional Degree Correlation Summary
| Measurement | Crow | Immigrants from Scotland |
| Minimum | 0.53% | 0.84% |
| Maximum | 4.5% | 17.6% |
| Range | 4.0% | 16.7% |
| Mean | 2.0% | 5.8% |
| Median | 1.6% | 5.3% |
| Interquartile 25% (IQ1) | 0.93% | 3.2% |
| Interquartile 75% (IQ3) | 2.7% | 7.6% |
| Interquartile Range (IQR) | 1.7% | 4.4% |
| Standard Deviation (Sample) | 1.3% | 3.6% |
| Standard Deviation (Population) | 1.3% | 3.6% |
Similar Demographics by Professional Degree
Demographics Similar to Crow by Professional Degree
In terms of professional degree, the demographic groups most similar to Crow are Yaqui (3.2%, a difference of 0.060%), Inupiat (3.2%, a difference of 0.27%), Hispanic or Latino (3.2%, a difference of 0.35%), Tsimshian (3.2%, a difference of 0.72%), and Seminole (3.2%, a difference of 1.1%).
| Demographics | Rating | Rank | Professional Degree |
| Nepalese | 0.1 /100 | #317 | Tragic 3.2% |
| Immigrants | Micronesia | 0.1 /100 | #318 | Tragic 3.2% |
| Choctaw | 0.1 /100 | #319 | Tragic 3.2% |
| Seminole | 0.1 /100 | #320 | Tragic 3.2% |
| Tsimshian | 0.0 /100 | #321 | Tragic 3.2% |
| Hispanics or Latinos | 0.0 /100 | #322 | Tragic 3.2% |
| Inupiat | 0.0 /100 | #323 | Tragic 3.2% |
| Crow | 0.0 /100 | #324 | Tragic 3.2% |
| Yaqui | 0.0 /100 | #325 | Tragic 3.2% |
| Menominee | 0.0 /100 | #326 | Tragic 3.1% |
| Dutch West Indians | 0.0 /100 | #327 | Tragic 3.1% |
| Creek | 0.0 /100 | #328 | Tragic 3.1% |
| Bangladeshis | 0.0 /100 | #329 | Tragic 3.1% |
| Immigrants | Cabo Verde | 0.0 /100 | #330 | Tragic 3.1% |
| Kiowa | 0.0 /100 | #331 | Tragic 3.1% |
Demographics Similar to Immigrants from Scotland by Professional Degree
In terms of professional degree, the demographic groups most similar to Immigrants from Scotland are Egyptian (5.3%, a difference of 0.10%), Chilean (5.3%, a difference of 0.10%), Laotian (5.2%, a difference of 0.16%), Immigrants from Eastern Europe (5.2%, a difference of 0.20%), and Immigrants from Chile (5.3%, a difference of 0.24%).
| Demographics | Rating | Rank | Professional Degree |
| Carpatho Rusyns | 99.6 /100 | #83 | Exceptional 5.3% |
| Immigrants | Croatia | 99.6 /100 | #84 | Exceptional 5.3% |
| Immigrants | Zimbabwe | 99.6 /100 | #85 | Exceptional 5.3% |
| Greeks | 99.6 /100 | #86 | Exceptional 5.3% |
| Immigrants | Chile | 99.5 /100 | #87 | Exceptional 5.3% |
| Egyptians | 99.5 /100 | #88 | Exceptional 5.3% |
| Chileans | 99.5 /100 | #89 | Exceptional 5.3% |
| Immigrants | Scotland | 99.5 /100 | #90 | Exceptional 5.3% |
| Laotians | 99.5 /100 | #91 | Exceptional 5.2% |
| Immigrants | Eastern Europe | 99.5 /100 | #92 | Exceptional 5.2% |
| Northern Europeans | 99.3 /100 | #93 | Exceptional 5.2% |
| Alsatians | 99.3 /100 | #94 | Exceptional 5.2% |
| Zimbabweans | 99.3 /100 | #95 | Exceptional 5.2% |
| Immigrants | Uzbekistan | 99.2 /100 | #96 | Exceptional 5.2% |
| Syrians | 99.1 /100 | #97 | Exceptional 5.2% |