Tongan vs Immigrants from Fiji Unemployment Among Ages 55 to 59 years
COMPARE
Tongan
Immigrants from Fiji
Unemployment Among Ages 55 to 59 years
Unemployment Among Ages 55 to 59 years Comparison
Tongans
Immigrants from Fiji
4.3%
UNEMPLOYMENT AMONG AGES 55 TO 59 YEARS
100.0/ 100
METRIC RATING
10th/ 347
METRIC RANK
5.1%
UNEMPLOYMENT AMONG AGES 55 TO 59 YEARS
0.7/ 100
METRIC RATING
244th/ 347
METRIC RANK
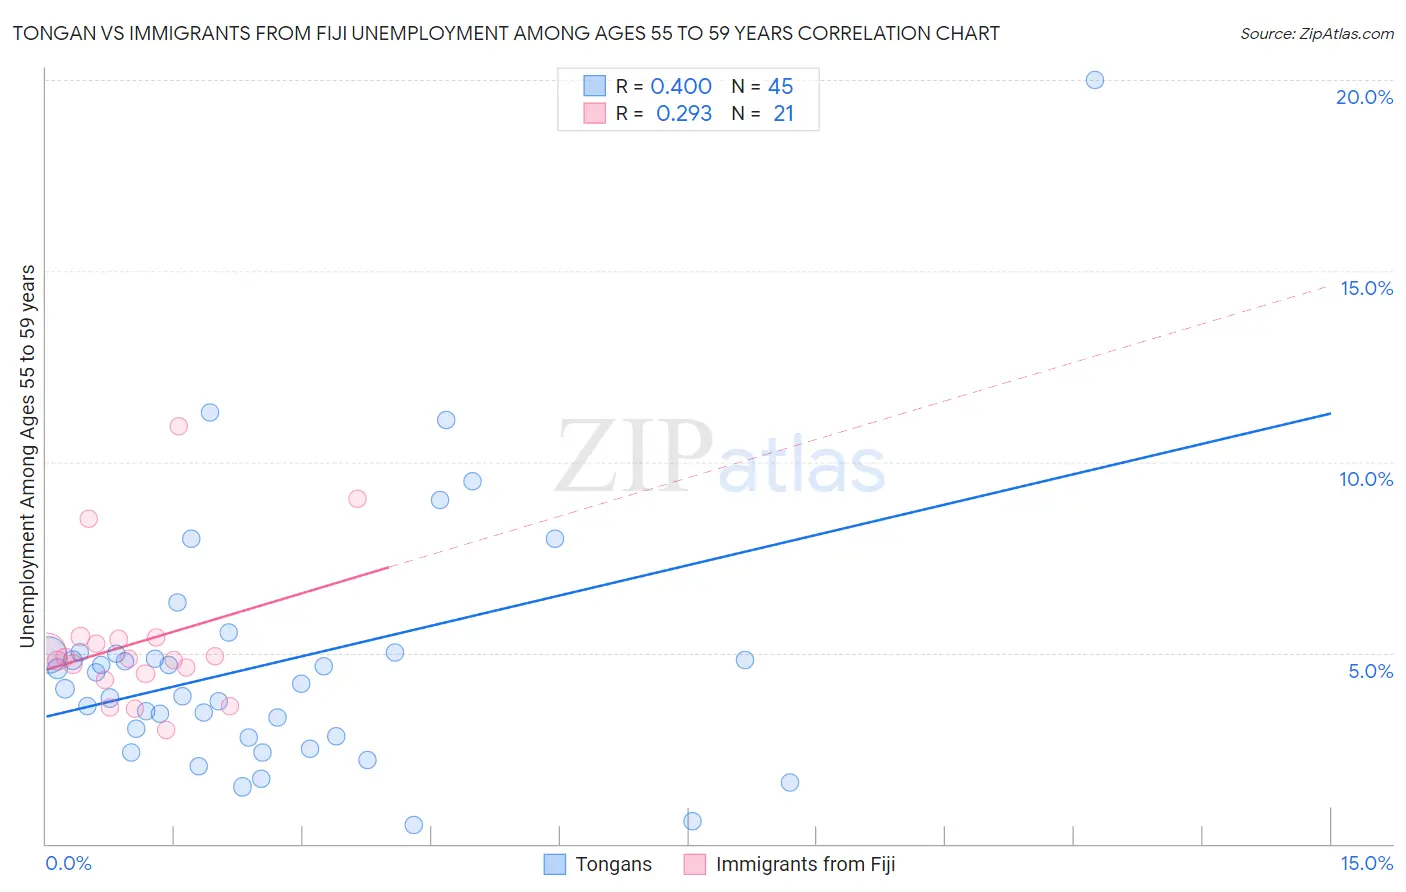
Tongan vs Immigrants from Fiji Unemployment Among Ages 55 to 59 years Correlation Chart
The statistical analysis conducted on geographies consisting of 99,745,911 people shows a moderate positive correlation between the proportion of Tongans and unemployment rate among population between the ages 55 and 59 in the United States with a correlation coefficient (R) of 0.400 and weighted average of 4.3%. Similarly, the statistical analysis conducted on geographies consisting of 92,482,788 people shows a weak positive correlation between the proportion of Immigrants from Fiji and unemployment rate among population between the ages 55 and 59 in the United States with a correlation coefficient (R) of 0.293 and weighted average of 5.1%, a difference of 18.2%.
Unemployment Among Ages 55 to 59 years Correlation Summary
| Measurement | Tongan | Immigrants from Fiji |
| Minimum | 0.50% | 3.0% |
| Maximum | 20.0% | 10.9% |
| Range | 19.5% | 7.9% |
| Mean | 4.8% | 5.3% |
| Median | 4.2% | 4.9% |
| Interquartile 25% (IQ1) | 2.8% | 4.4% |
| Interquartile 75% (IQ3) | 5.0% | 5.4% |
| Interquartile Range (IQR) | 2.2% | 1.00% |
| Standard Deviation (Sample) | 3.4% | 1.9% |
| Standard Deviation (Population) | 3.3% | 1.9% |
Similar Demographics by Unemployment Among Ages 55 to 59 years
Demographics Similar to Tongans by Unemployment Among Ages 55 to 59 years
In terms of unemployment among ages 55 to 59 years, the demographic groups most similar to Tongans are Immigrants from Congo (4.3%, a difference of 0.51%), Danish (4.3%, a difference of 0.71%), Indonesian (4.3%, a difference of 0.97%), Cuban (4.2%, a difference of 0.98%), and Bolivian (4.2%, a difference of 1.1%).
| Demographics | Rating | Rank | Unemployment Among Ages 55 to 59 years |
| Immigrants | Venezuela | 100.0 /100 | #3 | Exceptional 4.1% |
| Venezuelans | 100.0 /100 | #4 | Exceptional 4.2% |
| Immigrants | Bolivia | 100.0 /100 | #5 | Exceptional 4.2% |
| Norwegians | 100.0 /100 | #6 | Exceptional 4.2% |
| Zimbabweans | 100.0 /100 | #7 | Exceptional 4.2% |
| Bolivians | 100.0 /100 | #8 | Exceptional 4.2% |
| Cubans | 100.0 /100 | #9 | Exceptional 4.2% |
| Tongans | 100.0 /100 | #10 | Exceptional 4.3% |
| Immigrants | Congo | 100.0 /100 | #11 | Exceptional 4.3% |
| Danes | 100.0 /100 | #12 | Exceptional 4.3% |
| Indonesians | 100.0 /100 | #13 | Exceptional 4.3% |
| Immigrants | India | 100.0 /100 | #14 | Exceptional 4.3% |
| Bulgarians | 100.0 /100 | #15 | Exceptional 4.3% |
| Somalis | 100.0 /100 | #16 | Exceptional 4.4% |
| Czechs | 100.0 /100 | #17 | Exceptional 4.4% |
Demographics Similar to Immigrants from Fiji by Unemployment Among Ages 55 to 59 years
In terms of unemployment among ages 55 to 59 years, the demographic groups most similar to Immigrants from Fiji are Honduran (5.1%, a difference of 0.010%), Soviet Union (5.1%, a difference of 0.21%), Liberian (5.1%, a difference of 0.22%), Immigrants from Greece (5.1%, a difference of 0.23%), and Immigrants from Honduras (5.1%, a difference of 0.24%).
| Demographics | Rating | Rank | Unemployment Among Ages 55 to 59 years |
| Choctaw | 1.3 /100 | #237 | Tragic 5.0% |
| Moroccans | 1.3 /100 | #238 | Tragic 5.0% |
| French American Indians | 1.2 /100 | #239 | Tragic 5.0% |
| Immigrants | Costa Rica | 1.1 /100 | #240 | Tragic 5.0% |
| Brazilians | 1.0 /100 | #241 | Tragic 5.0% |
| Liberians | 0.9 /100 | #242 | Tragic 5.1% |
| Hondurans | 0.7 /100 | #243 | Tragic 5.1% |
| Immigrants | Fiji | 0.7 /100 | #244 | Tragic 5.1% |
| Soviet Union | 0.6 /100 | #245 | Tragic 5.1% |
| Immigrants | Greece | 0.6 /100 | #246 | Tragic 5.1% |
| Immigrants | Honduras | 0.5 /100 | #247 | Tragic 5.1% |
| Native Hawaiians | 0.5 /100 | #248 | Tragic 5.1% |
| Comanche | 0.4 /100 | #249 | Tragic 5.1% |
| Cheyenne | 0.4 /100 | #250 | Tragic 5.1% |
| Portuguese | 0.3 /100 | #251 | Tragic 5.1% |