Tongan vs British West Indian 8th Grade
COMPARE
Tongan
British West Indian
8th Grade
8th Grade Comparison
Tongans
British West Indians
95.1%
8TH GRADE
1.7/ 100
METRIC RATING
242nd/ 347
METRIC RANK
94.4%
8TH GRADE
0.0/ 100
METRIC RATING
289th/ 347
METRIC RANK
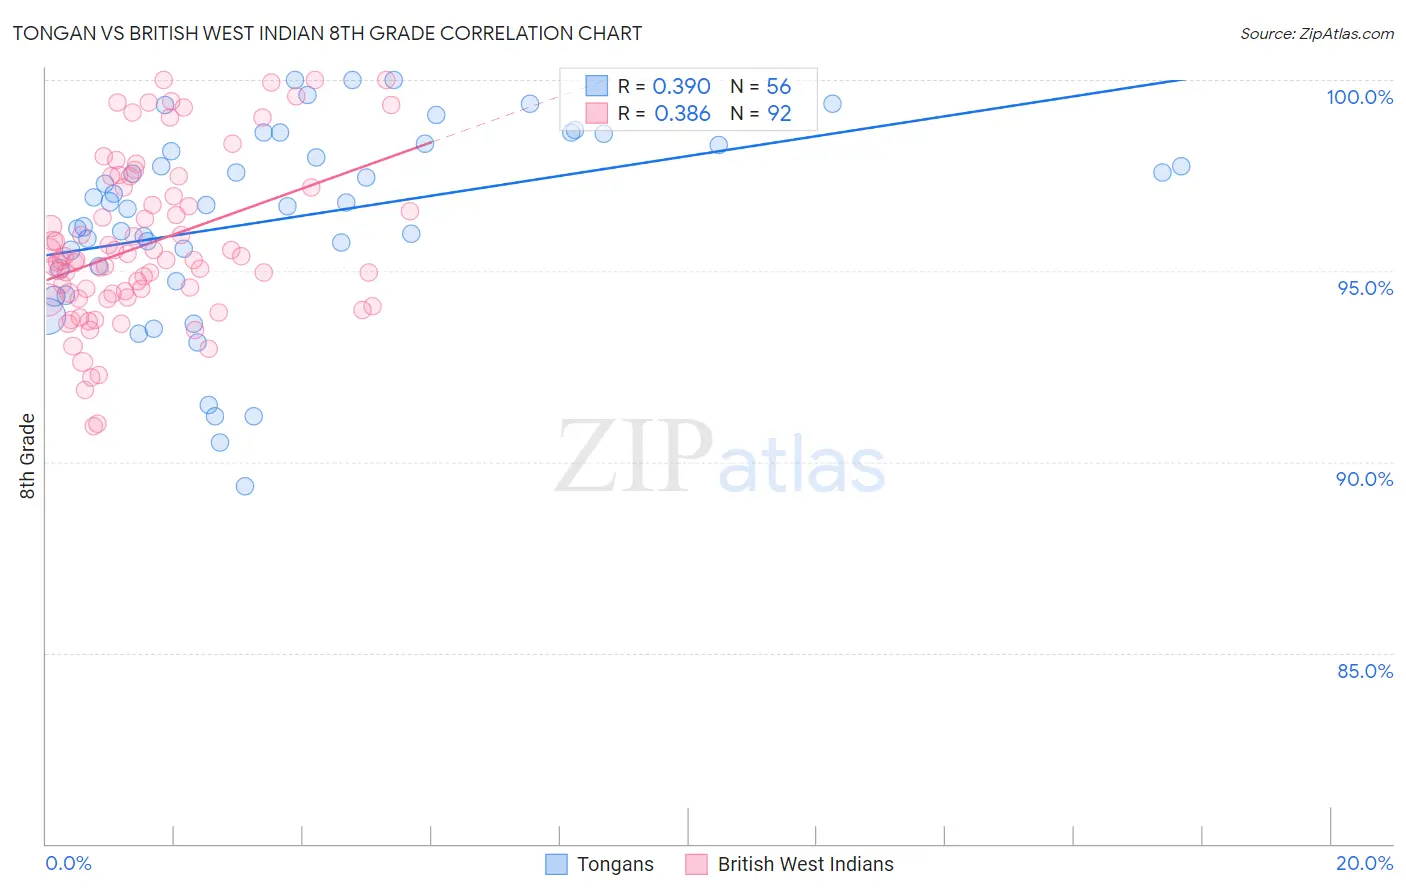
Tongan vs British West Indian 8th Grade Correlation Chart
The statistical analysis conducted on geographies consisting of 102,873,790 people shows a mild positive correlation between the proportion of Tongans and percentage of population with at least 8th grade education in the United States with a correlation coefficient (R) of 0.390 and weighted average of 95.1%. Similarly, the statistical analysis conducted on geographies consisting of 152,691,173 people shows a mild positive correlation between the proportion of British West Indians and percentage of population with at least 8th grade education in the United States with a correlation coefficient (R) of 0.386 and weighted average of 94.4%, a difference of 0.75%.
8th Grade Correlation Summary
| Measurement | Tongan | British West Indian |
| Minimum | 89.4% | 90.9% |
| Maximum | 100.0% | 100.0% |
| Range | 10.6% | 9.1% |
| Mean | 96.4% | 95.7% |
| Median | 96.8% | 95.3% |
| Interquartile 25% (IQ1) | 95.1% | 94.3% |
| Interquartile 75% (IQ3) | 98.3% | 97.2% |
| Interquartile Range (IQR) | 3.2% | 2.8% |
| Standard Deviation (Sample) | 2.5% | 2.1% |
| Standard Deviation (Population) | 2.5% | 2.1% |
Similar Demographics by 8th Grade
Demographics Similar to Tongans by 8th Grade
In terms of 8th grade, the demographic groups most similar to Tongans are Paiute (95.1%, a difference of 0.0%), Immigrants from Middle Africa (95.1%, a difference of 0.0%), Ethiopian (95.1%, a difference of 0.020%), South American Indian (95.1%, a difference of 0.020%), and Immigrants from Sierra Leone (95.1%, a difference of 0.030%).
| Demographics | Rating | Rank | 8th Grade |
| Nigerians | 2.9 /100 | #235 | Tragic 95.2% |
| Senegalese | 2.7 /100 | #236 | Tragic 95.2% |
| Immigrants | Africa | 2.7 /100 | #237 | Tragic 95.2% |
| Natives/Alaskans | 2.3 /100 | #238 | Tragic 95.2% |
| Immigrants | Sierra Leone | 2.1 /100 | #239 | Tragic 95.1% |
| Ethiopians | 2.0 /100 | #240 | Tragic 95.1% |
| South American Indians | 1.9 /100 | #241 | Tragic 95.1% |
| Tongans | 1.7 /100 | #242 | Tragic 95.1% |
| Paiute | 1.7 /100 | #243 | Tragic 95.1% |
| Immigrants | Middle Africa | 1.7 /100 | #244 | Tragic 95.1% |
| Jamaicans | 1.4 /100 | #245 | Tragic 95.1% |
| Somalis | 1.4 /100 | #246 | Tragic 95.1% |
| Immigrants | Senegal | 1.4 /100 | #247 | Tragic 95.1% |
| Uruguayans | 1.2 /100 | #248 | Tragic 95.1% |
| Immigrants | China | 1.1 /100 | #249 | Tragic 95.0% |
Demographics Similar to British West Indians by 8th Grade
In terms of 8th grade, the demographic groups most similar to British West Indians are Malaysian (94.5%, a difference of 0.060%), Immigrants from West Indies (94.3%, a difference of 0.070%), Immigrants from Grenada (94.3%, a difference of 0.080%), Immigrants from Peru (94.5%, a difference of 0.090%), and Tohono O'odham (94.5%, a difference of 0.090%).
| Demographics | Rating | Rank | 8th Grade |
| Immigrants | Eritrea | 0.1 /100 | #282 | Tragic 94.6% |
| Immigrants | St. Vincent and the Grenadines | 0.1 /100 | #283 | Tragic 94.6% |
| Immigrants | Philippines | 0.1 /100 | #284 | Tragic 94.6% |
| Immigrants | Barbados | 0.0 /100 | #285 | Tragic 94.5% |
| Immigrants | Peru | 0.0 /100 | #286 | Tragic 94.5% |
| Tohono O'odham | 0.0 /100 | #287 | Tragic 94.5% |
| Malaysians | 0.0 /100 | #288 | Tragic 94.5% |
| British West Indians | 0.0 /100 | #289 | Tragic 94.4% |
| Immigrants | West Indies | 0.0 /100 | #290 | Tragic 94.3% |
| Immigrants | Grenada | 0.0 /100 | #291 | Tragic 94.3% |
| Bangladeshis | 0.0 /100 | #292 | Tragic 94.3% |
| Yaqui | 0.0 /100 | #293 | Tragic 94.2% |
| Houma | 0.0 /100 | #294 | Tragic 94.2% |
| Fijians | 0.0 /100 | #295 | Tragic 94.2% |
| Haitians | 0.0 /100 | #296 | Tragic 94.2% |