Immigrants from Guyana vs British West Indian 9th Grade
COMPARE
Immigrants from Guyana
British West Indian
9th Grade
9th Grade Comparison
Immigrants from Guyana
British West Indians
92.5%
9TH GRADE
0.0/ 100
METRIC RATING
308th/ 347
METRIC RANK
93.2%
9TH GRADE
0.0/ 100
METRIC RATING
291st/ 347
METRIC RANK
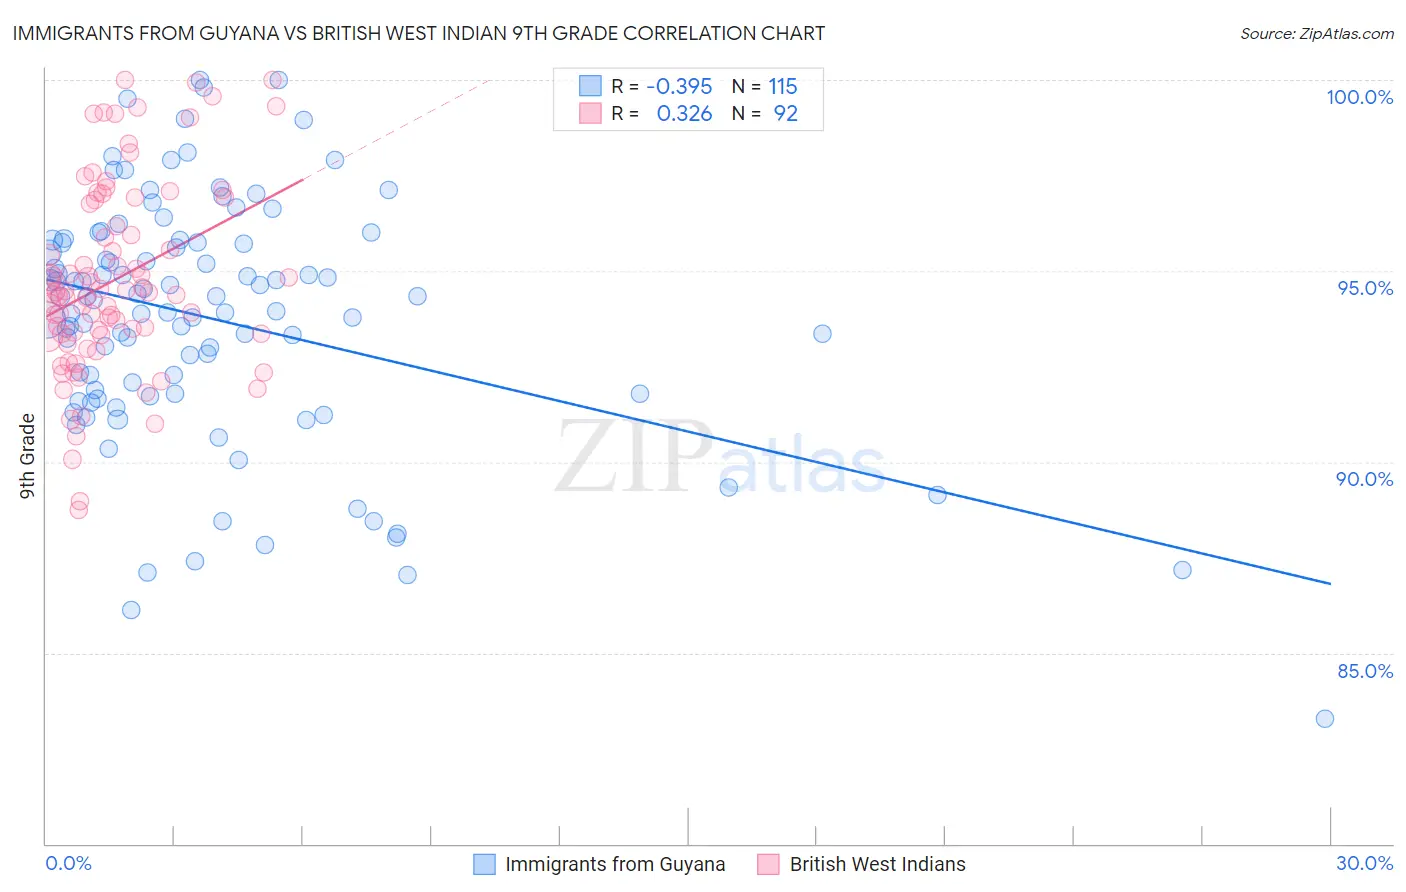
Immigrants from Guyana vs British West Indian 9th Grade Correlation Chart
The statistical analysis conducted on geographies consisting of 183,673,461 people shows a mild negative correlation between the proportion of Immigrants from Guyana and percentage of population with at least 9th grade education in the United States with a correlation coefficient (R) of -0.395 and weighted average of 92.5%. Similarly, the statistical analysis conducted on geographies consisting of 152,691,173 people shows a mild positive correlation between the proportion of British West Indians and percentage of population with at least 9th grade education in the United States with a correlation coefficient (R) of 0.326 and weighted average of 93.2%, a difference of 0.74%.
9th Grade Correlation Summary
| Measurement | Immigrants from Guyana | British West Indian |
| Minimum | 83.3% | 88.8% |
| Maximum | 100.0% | 100.0% |
| Range | 16.7% | 11.2% |
| Mean | 93.7% | 94.8% |
| Median | 94.3% | 94.4% |
| Interquartile 25% (IQ1) | 91.8% | 93.3% |
| Interquartile 75% (IQ3) | 95.7% | 96.8% |
| Interquartile Range (IQR) | 4.0% | 3.5% |
| Standard Deviation (Sample) | 3.2% | 2.5% |
| Standard Deviation (Population) | 3.2% | 2.5% |
Demographics Similar to Immigrants from Guyana and British West Indians by 9th Grade
In terms of 9th grade, the demographic groups most similar to Immigrants from Guyana are Immigrants (92.5%, a difference of 0.010%), Japanese (92.6%, a difference of 0.11%), Immigrants from Vietnam (92.6%, a difference of 0.11%), Tohono O'odham (92.6%, a difference of 0.13%), and Guyanese (92.7%, a difference of 0.15%). Similarly, the demographic groups most similar to British West Indians are Immigrants from Laos (93.2%, a difference of 0.020%), Sri Lankan (93.2%, a difference of 0.030%), Cuban (93.2%, a difference of 0.030%), Immigrants from Burma/Myanmar (93.1%, a difference of 0.050%), and Indonesian (93.1%, a difference of 0.060%).
| Demographics | Rating | Rank | 9th Grade |
| Immigrants | West Indies | 0.0 /100 | #289 | Tragic 93.3% |
| Pennsylvania Germans | 0.0 /100 | #290 | Tragic 93.3% |
| British West Indians | 0.0 /100 | #291 | Tragic 93.2% |
| Immigrants | Laos | 0.0 /100 | #292 | Tragic 93.2% |
| Sri Lankans | 0.0 /100 | #293 | Tragic 93.2% |
| Cubans | 0.0 /100 | #294 | Tragic 93.2% |
| Immigrants | Burma/Myanmar | 0.0 /100 | #295 | Tragic 93.1% |
| Indonesians | 0.0 /100 | #296 | Tragic 93.1% |
| Fijians | 0.0 /100 | #297 | Tragic 93.1% |
| Haitians | 0.0 /100 | #298 | Tragic 93.1% |
| Immigrants | Grenada | 0.0 /100 | #299 | Tragic 93.0% |
| Yaqui | 0.0 /100 | #300 | Tragic 92.9% |
| Immigrants | Haiti | 0.0 /100 | #301 | Tragic 92.7% |
| Immigrants | Dominica | 0.0 /100 | #302 | Tragic 92.7% |
| Guyanese | 0.0 /100 | #303 | Tragic 92.7% |
| Tohono O'odham | 0.0 /100 | #304 | Tragic 92.6% |
| Japanese | 0.0 /100 | #305 | Tragic 92.6% |
| Immigrants | Vietnam | 0.0 /100 | #306 | Tragic 92.6% |
| Immigrants | Immigrants | 0.0 /100 | #307 | Tragic 92.5% |
| Immigrants | Guyana | 0.0 /100 | #308 | Tragic 92.5% |
| Immigrants | Bangladesh | 0.0 /100 | #309 | Tragic 92.4% |