Mongolian vs British West Indian 9th Grade
COMPARE
Mongolian
British West Indian
9th Grade
9th Grade Comparison
Mongolians
British West Indians
95.0%
9TH GRADE
73.0/ 100
METRIC RATING
157th/ 347
METRIC RANK
93.2%
9TH GRADE
0.0/ 100
METRIC RATING
291st/ 347
METRIC RANK
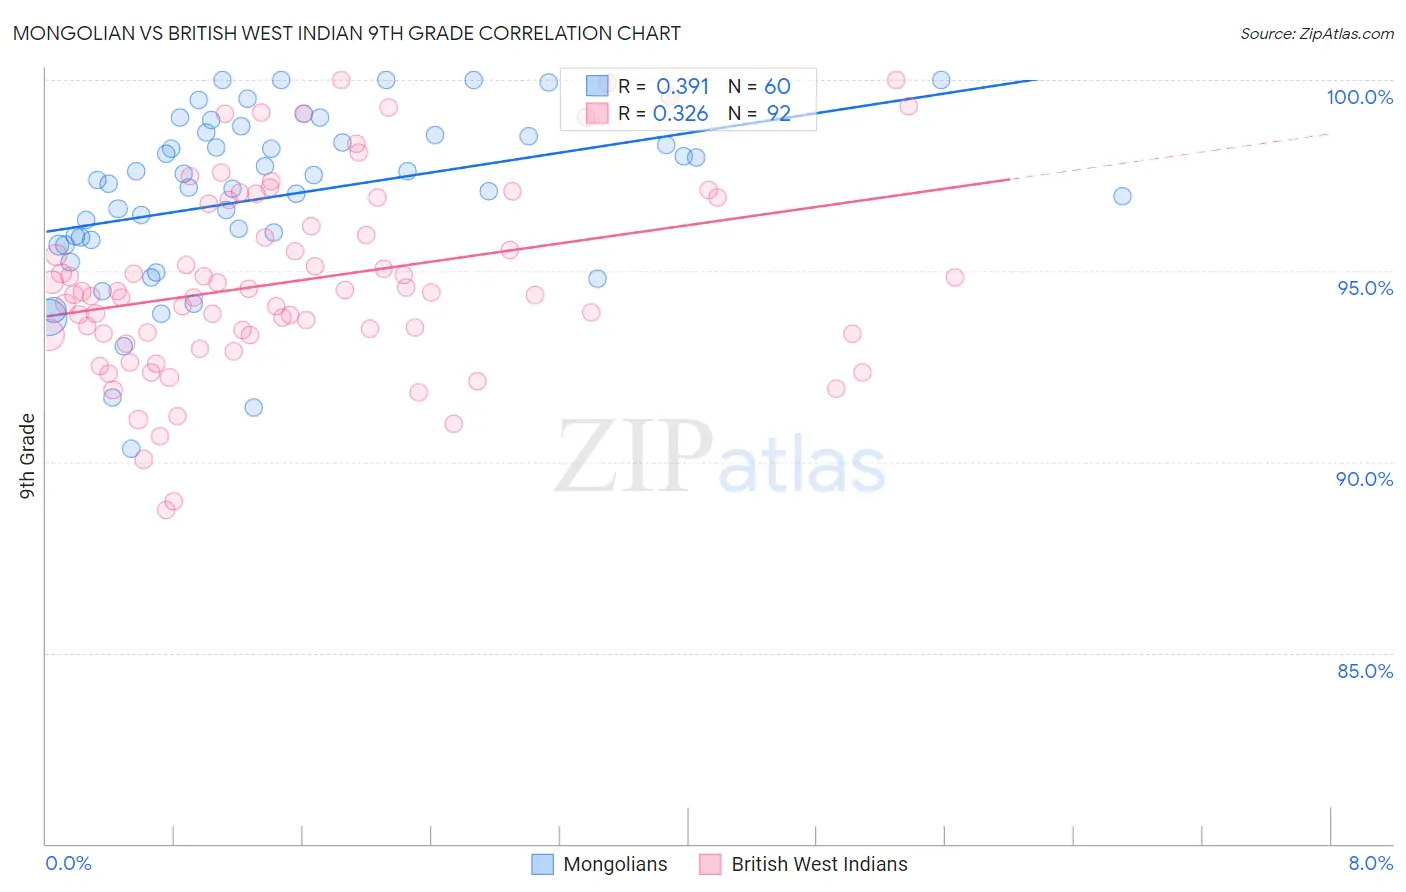
Mongolian vs British West Indian 9th Grade Correlation Chart
The statistical analysis conducted on geographies consisting of 140,247,278 people shows a mild positive correlation between the proportion of Mongolians and percentage of population with at least 9th grade education in the United States with a correlation coefficient (R) of 0.391 and weighted average of 95.0%. Similarly, the statistical analysis conducted on geographies consisting of 152,691,173 people shows a mild positive correlation between the proportion of British West Indians and percentage of population with at least 9th grade education in the United States with a correlation coefficient (R) of 0.326 and weighted average of 93.2%, a difference of 2.0%.
9th Grade Correlation Summary
| Measurement | Mongolian | British West Indian |
| Minimum | 90.4% | 88.8% |
| Maximum | 100.0% | 100.0% |
| Range | 9.6% | 11.2% |
| Mean | 96.9% | 94.8% |
| Median | 97.3% | 94.4% |
| Interquartile 25% (IQ1) | 95.7% | 93.3% |
| Interquartile 75% (IQ3) | 98.6% | 96.8% |
| Interquartile Range (IQR) | 2.8% | 3.5% |
| Standard Deviation (Sample) | 2.2% | 2.5% |
| Standard Deviation (Population) | 2.2% | 2.5% |
Similar Demographics by 9th Grade
Demographics Similar to Mongolians by 9th Grade
In terms of 9th grade, the demographic groups most similar to Mongolians are Immigrants from Kenya (95.0%, a difference of 0.0%), Arab (95.1%, a difference of 0.020%), Immigrants from Kazakhstan (95.1%, a difference of 0.020%), Albanian (95.1%, a difference of 0.030%), and Egyptian (95.0%, a difference of 0.030%).
| Demographics | Rating | Rank | 9th Grade |
| Kenyans | 79.1 /100 | #150 | Good 95.1% |
| Cajuns | 77.3 /100 | #151 | Good 95.1% |
| Ugandans | 77.0 /100 | #152 | Good 95.1% |
| Albanians | 76.1 /100 | #153 | Good 95.1% |
| Arabs | 74.9 /100 | #154 | Good 95.1% |
| Immigrants | Kazakhstan | 74.7 /100 | #155 | Good 95.1% |
| Immigrants | Kenya | 73.1 /100 | #156 | Good 95.0% |
| Mongolians | 73.0 /100 | #157 | Good 95.0% |
| Egyptians | 70.1 /100 | #158 | Good 95.0% |
| Immigrants | Ukraine | 67.4 /100 | #159 | Good 95.0% |
| Immigrants | Italy | 66.6 /100 | #160 | Good 95.0% |
| French American Indians | 66.5 /100 | #161 | Good 95.0% |
| Bermudans | 65.8 /100 | #162 | Good 95.0% |
| Pakistanis | 64.1 /100 | #163 | Good 95.0% |
| Venezuelans | 63.6 /100 | #164 | Good 95.0% |
Demographics Similar to British West Indians by 9th Grade
In terms of 9th grade, the demographic groups most similar to British West Indians are Immigrants from Laos (93.2%, a difference of 0.020%), Sri Lankan (93.2%, a difference of 0.030%), Cuban (93.2%, a difference of 0.030%), Immigrants from Burma/Myanmar (93.1%, a difference of 0.050%), and Indonesian (93.1%, a difference of 0.060%).
| Demographics | Rating | Rank | 9th Grade |
| Bangladeshis | 0.0 /100 | #284 | Tragic 93.4% |
| Immigrants | Peru | 0.0 /100 | #285 | Tragic 93.4% |
| Immigrants | Barbados | 0.0 /100 | #286 | Tragic 93.4% |
| Immigrants | St. Vincent and the Grenadines | 0.0 /100 | #287 | Tragic 93.4% |
| Immigrants | South Eastern Asia | 0.0 /100 | #288 | Tragic 93.3% |
| Immigrants | West Indies | 0.0 /100 | #289 | Tragic 93.3% |
| Pennsylvania Germans | 0.0 /100 | #290 | Tragic 93.3% |
| British West Indians | 0.0 /100 | #291 | Tragic 93.2% |
| Immigrants | Laos | 0.0 /100 | #292 | Tragic 93.2% |
| Sri Lankans | 0.0 /100 | #293 | Tragic 93.2% |
| Cubans | 0.0 /100 | #294 | Tragic 93.2% |
| Immigrants | Burma/Myanmar | 0.0 /100 | #295 | Tragic 93.1% |
| Indonesians | 0.0 /100 | #296 | Tragic 93.1% |
| Fijians | 0.0 /100 | #297 | Tragic 93.1% |
| Haitians | 0.0 /100 | #298 | Tragic 93.1% |