Immigrants from India vs Arab Master's Degree
COMPARE
Immigrants from India
Arab
Master's Degree
Master's Degree Comparison
Immigrants from India
Arabs
22.3%
MASTER'S DEGREE
100.0/ 100
METRIC RATING
6th/ 347
METRIC RANK
16.7%
MASTER'S DEGREE
97.7/ 100
METRIC RATING
113th/ 347
METRIC RANK
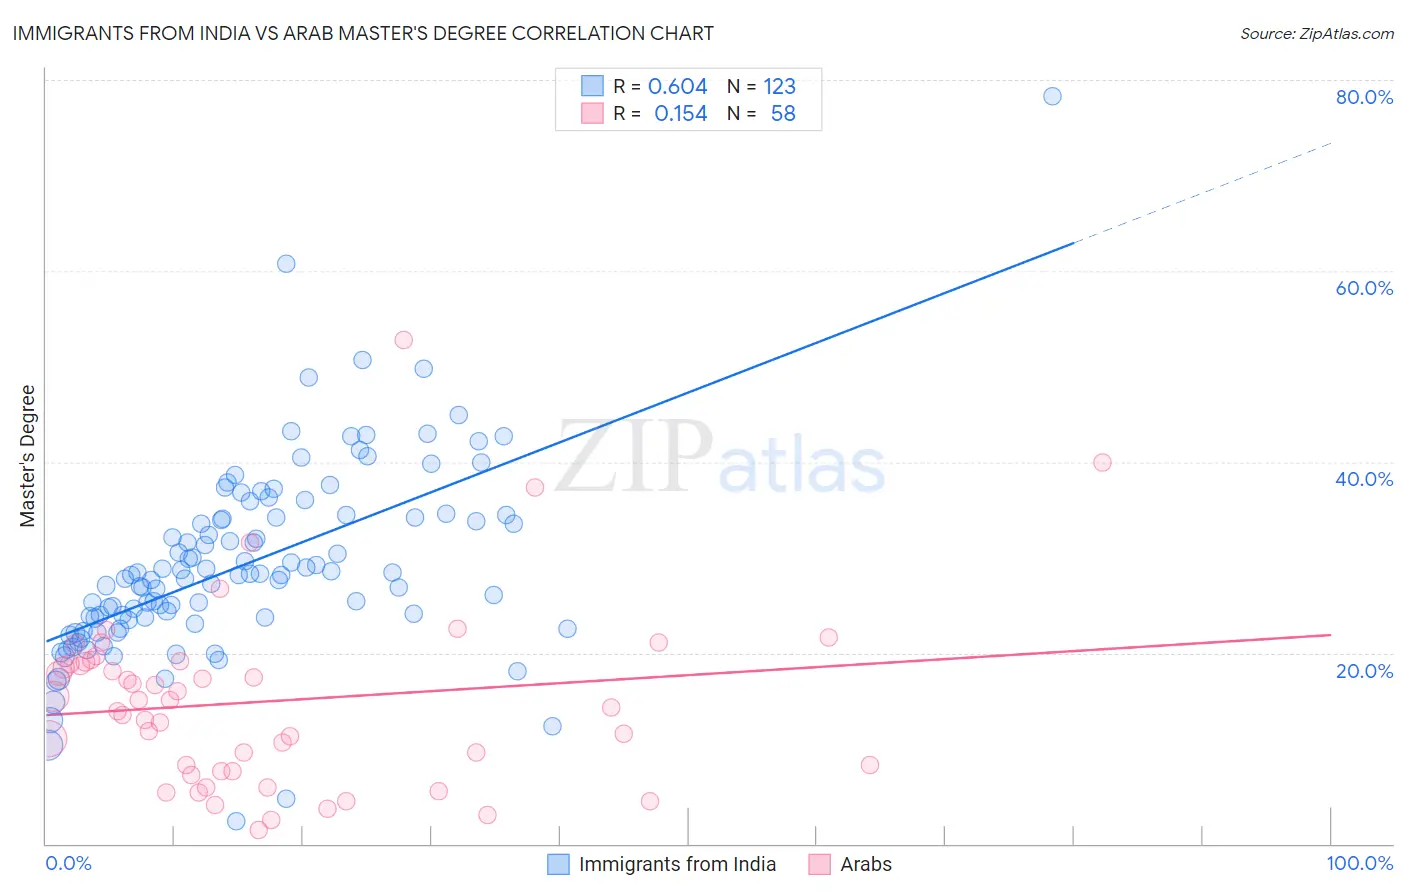
Immigrants from India vs Arab Master's Degree Correlation Chart
The statistical analysis conducted on geographies consisting of 433,961,661 people shows a significant positive correlation between the proportion of Immigrants from India and percentage of population with at least master's degree education in the United States with a correlation coefficient (R) of 0.604 and weighted average of 22.3%. Similarly, the statistical analysis conducted on geographies consisting of 486,607,303 people shows a poor positive correlation between the proportion of Arabs and percentage of population with at least master's degree education in the United States with a correlation coefficient (R) of 0.154 and weighted average of 16.7%, a difference of 33.6%.
Master's Degree Correlation Summary
| Measurement | Immigrants from India | Arab |
| Minimum | 2.4% | 1.5% |
| Maximum | 78.4% | 52.8% |
| Range | 76.0% | 51.4% |
| Mean | 29.2% | 14.9% |
| Median | 28.2% | 14.7% |
| Interquartile 25% (IQ1) | 23.4% | 7.6% |
| Interquartile 75% (IQ3) | 34.2% | 19.1% |
| Interquartile Range (IQR) | 10.8% | 11.5% |
| Standard Deviation (Sample) | 10.1% | 9.5% |
| Standard Deviation (Population) | 10.0% | 9.5% |
Similar Demographics by Master's Degree
Demographics Similar to Immigrants from India by Master's Degree
In terms of master's degree, the demographic groups most similar to Immigrants from India are Iranian (22.3%, a difference of 0.21%), Immigrants from Taiwan (22.5%, a difference of 0.68%), Immigrants from Israel (22.6%, a difference of 1.5%), Okinawan (22.6%, a difference of 1.5%), and Cypriot (21.8%, a difference of 2.4%).
| Demographics | Rating | Rank | Master's Degree |
| Immigrants | Singapore | 100.0 /100 | #1 | Exceptional 23.4% |
| Filipinos | 100.0 /100 | #2 | Exceptional 23.4% |
| Immigrants | Israel | 100.0 /100 | #3 | Exceptional 22.6% |
| Okinawans | 100.0 /100 | #4 | Exceptional 22.6% |
| Immigrants | Taiwan | 100.0 /100 | #5 | Exceptional 22.5% |
| Immigrants | India | 100.0 /100 | #6 | Exceptional 22.3% |
| Iranians | 100.0 /100 | #7 | Exceptional 22.3% |
| Cypriots | 100.0 /100 | #8 | Exceptional 21.8% |
| Thais | 100.0 /100 | #9 | Exceptional 21.7% |
| Immigrants | Iran | 100.0 /100 | #10 | Exceptional 21.6% |
| Immigrants | China | 100.0 /100 | #11 | Exceptional 21.2% |
| Eastern Europeans | 100.0 /100 | #12 | Exceptional 21.1% |
| Immigrants | Australia | 100.0 /100 | #13 | Exceptional 20.9% |
| Immigrants | Switzerland | 100.0 /100 | #14 | Exceptional 20.9% |
| Immigrants | Eastern Asia | 100.0 /100 | #15 | Exceptional 20.8% |
Demographics Similar to Arabs by Master's Degree
In terms of master's degree, the demographic groups most similar to Arabs are Macedonian (16.7%, a difference of 0.010%), Northern European (16.7%, a difference of 0.070%), Austrian (16.7%, a difference of 0.15%), Immigrants from Uganda (16.6%, a difference of 0.37%), and Immigrants from Chile (16.8%, a difference of 0.42%).
| Demographics | Rating | Rank | Master's Degree |
| Immigrants | Albania | 98.1 /100 | #106 | Exceptional 16.8% |
| Armenians | 98.0 /100 | #107 | Exceptional 16.8% |
| Sierra Leoneans | 98.0 /100 | #108 | Exceptional 16.8% |
| Moroccans | 98.0 /100 | #109 | Exceptional 16.8% |
| Immigrants | Chile | 98.0 /100 | #110 | Exceptional 16.8% |
| Austrians | 97.8 /100 | #111 | Exceptional 16.7% |
| Macedonians | 97.7 /100 | #112 | Exceptional 16.7% |
| Arabs | 97.7 /100 | #113 | Exceptional 16.7% |
| Northern Europeans | 97.6 /100 | #114 | Exceptional 16.7% |
| Immigrants | Uganda | 97.3 /100 | #115 | Exceptional 16.6% |
| Immigrants | Southern Europe | 97.2 /100 | #116 | Exceptional 16.6% |
| Immigrants | Moldova | 97.2 /100 | #117 | Exceptional 16.6% |
| Brazilians | 96.8 /100 | #118 | Exceptional 16.5% |
| Jordanians | 96.5 /100 | #119 | Exceptional 16.5% |
| Lebanese | 96.4 /100 | #120 | Exceptional 16.5% |