Immigrants from Norway vs Arab Master's Degree
COMPARE
Immigrants from Norway
Arab
Master's Degree
Master's Degree Comparison
Immigrants from Norway
Arabs
18.8%
MASTER'S DEGREE
100.0/ 100
METRIC RATING
46th/ 347
METRIC RANK
16.7%
MASTER'S DEGREE
97.7/ 100
METRIC RATING
113th/ 347
METRIC RANK
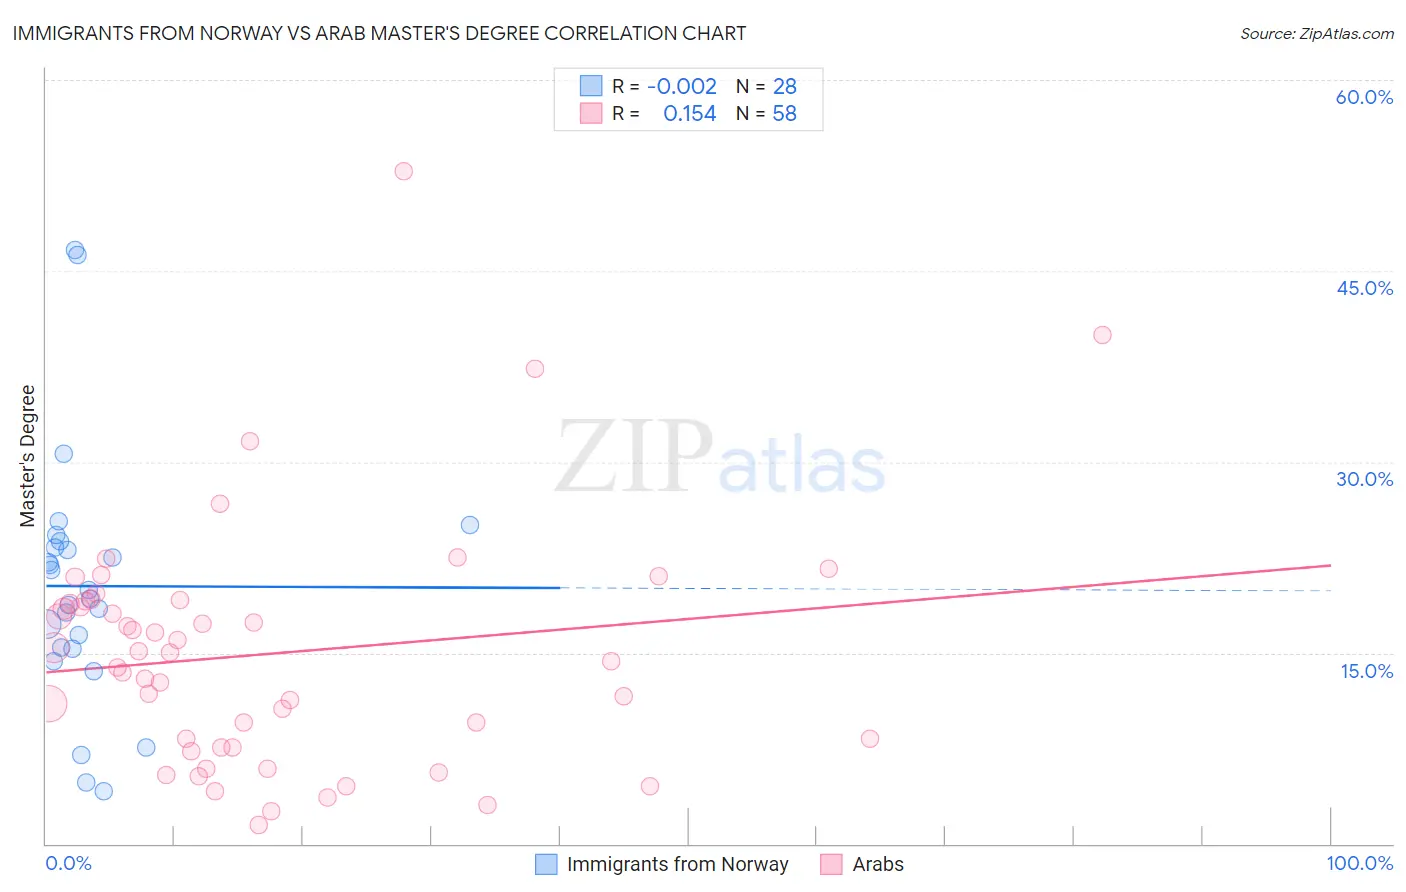
Immigrants from Norway vs Arab Master's Degree Correlation Chart
The statistical analysis conducted on geographies consisting of 116,700,664 people shows no correlation between the proportion of Immigrants from Norway and percentage of population with at least master's degree education in the United States with a correlation coefficient (R) of -0.002 and weighted average of 18.8%. Similarly, the statistical analysis conducted on geographies consisting of 486,607,303 people shows a poor positive correlation between the proportion of Arabs and percentage of population with at least master's degree education in the United States with a correlation coefficient (R) of 0.154 and weighted average of 16.7%, a difference of 12.7%.
Master's Degree Correlation Summary
| Measurement | Immigrants from Norway | Arab |
| Minimum | 4.2% | 1.5% |
| Maximum | 46.7% | 52.8% |
| Range | 42.5% | 51.4% |
| Mean | 20.2% | 14.9% |
| Median | 19.6% | 14.7% |
| Interquartile 25% (IQ1) | 15.4% | 7.6% |
| Interquartile 75% (IQ3) | 23.5% | 19.1% |
| Interquartile Range (IQR) | 8.1% | 11.5% |
| Standard Deviation (Sample) | 9.8% | 9.5% |
| Standard Deviation (Population) | 9.6% | 9.5% |
Similar Demographics by Master's Degree
Demographics Similar to Immigrants from Norway by Master's Degree
In terms of master's degree, the demographic groups most similar to Immigrants from Norway are Immigrants from Austria (18.8%, a difference of 0.010%), Paraguayan (18.8%, a difference of 0.070%), Estonian (18.8%, a difference of 0.17%), Bulgarian (18.8%, a difference of 0.35%), and Immigrants from South Africa (18.8%, a difference of 0.37%).
| Demographics | Rating | Rank | Master's Degree |
| Immigrants | Spain | 100.0 /100 | #39 | Exceptional 19.1% |
| Immigrants | Bolivia | 100.0 /100 | #40 | Exceptional 19.1% |
| Immigrants | Latvia | 100.0 /100 | #41 | Exceptional 19.1% |
| Immigrants | Saudi Arabia | 100.0 /100 | #42 | Exceptional 19.0% |
| Immigrants | Greece | 100.0 /100 | #43 | Exceptional 19.0% |
| Immigrants | Malaysia | 100.0 /100 | #44 | Exceptional 18.9% |
| Immigrants | Belarus | 100.0 /100 | #45 | Exceptional 18.9% |
| Immigrants | Norway | 100.0 /100 | #46 | Exceptional 18.8% |
| Immigrants | Austria | 100.0 /100 | #47 | Exceptional 18.8% |
| Paraguayans | 100.0 /100 | #48 | Exceptional 18.8% |
| Estonians | 100.0 /100 | #49 | Exceptional 18.8% |
| Bulgarians | 100.0 /100 | #50 | Exceptional 18.8% |
| Immigrants | South Africa | 100.0 /100 | #51 | Exceptional 18.8% |
| Immigrants | Kuwait | 100.0 /100 | #52 | Exceptional 18.6% |
| Immigrants | Czechoslovakia | 99.9 /100 | #53 | Exceptional 18.5% |
Demographics Similar to Arabs by Master's Degree
In terms of master's degree, the demographic groups most similar to Arabs are Macedonian (16.7%, a difference of 0.010%), Northern European (16.7%, a difference of 0.070%), Austrian (16.7%, a difference of 0.15%), Immigrants from Uganda (16.6%, a difference of 0.37%), and Immigrants from Chile (16.8%, a difference of 0.42%).
| Demographics | Rating | Rank | Master's Degree |
| Immigrants | Albania | 98.1 /100 | #106 | Exceptional 16.8% |
| Armenians | 98.0 /100 | #107 | Exceptional 16.8% |
| Sierra Leoneans | 98.0 /100 | #108 | Exceptional 16.8% |
| Moroccans | 98.0 /100 | #109 | Exceptional 16.8% |
| Immigrants | Chile | 98.0 /100 | #110 | Exceptional 16.8% |
| Austrians | 97.8 /100 | #111 | Exceptional 16.7% |
| Macedonians | 97.7 /100 | #112 | Exceptional 16.7% |
| Arabs | 97.7 /100 | #113 | Exceptional 16.7% |
| Northern Europeans | 97.6 /100 | #114 | Exceptional 16.7% |
| Immigrants | Uganda | 97.3 /100 | #115 | Exceptional 16.6% |
| Immigrants | Southern Europe | 97.2 /100 | #116 | Exceptional 16.6% |
| Immigrants | Moldova | 97.2 /100 | #117 | Exceptional 16.6% |
| Brazilians | 96.8 /100 | #118 | Exceptional 16.5% |
| Jordanians | 96.5 /100 | #119 | Exceptional 16.5% |
| Lebanese | 96.4 /100 | #120 | Exceptional 16.5% |