Irish vs Immigrants from Morocco Professional Degree
COMPARE
Irish
Immigrants from Morocco
Professional Degree
Professional Degree Comparison
Irish
Immigrants from Morocco
4.4%
PROFESSIONAL DEGREE
50.0/ 100
METRIC RATING
175th/ 347
METRIC RANK
5.0%
PROFESSIONAL DEGREE
96.8/ 100
METRIC RATING
114th/ 347
METRIC RANK
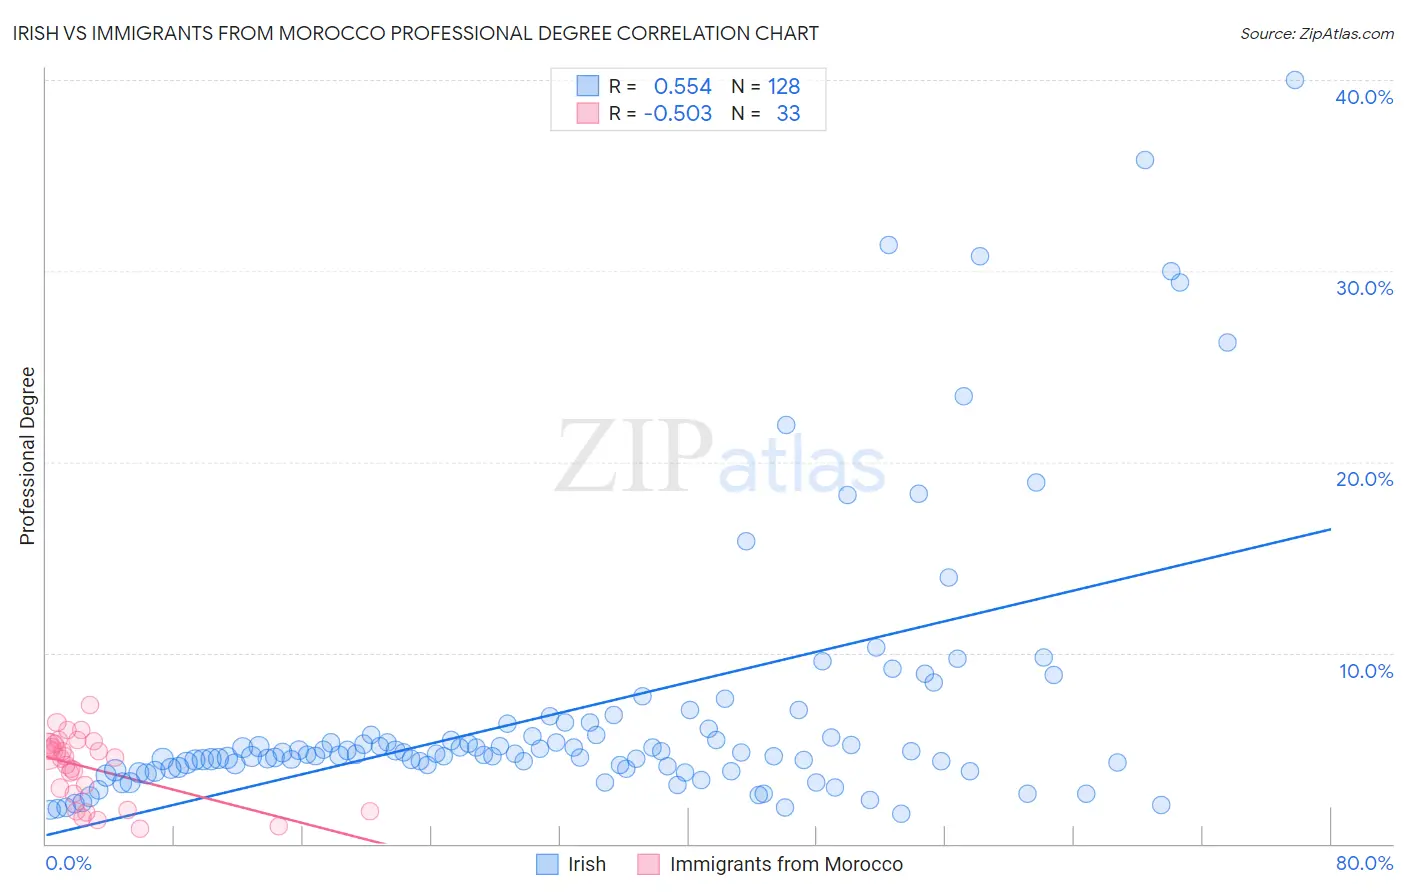
Irish vs Immigrants from Morocco Professional Degree Correlation Chart
The statistical analysis conducted on geographies consisting of 569,237,980 people shows a substantial positive correlation between the proportion of Irish and percentage of population with at least professional degree education in the United States with a correlation coefficient (R) of 0.554 and weighted average of 4.4%. Similarly, the statistical analysis conducted on geographies consisting of 178,862,837 people shows a substantial negative correlation between the proportion of Immigrants from Morocco and percentage of population with at least professional degree education in the United States with a correlation coefficient (R) of -0.503 and weighted average of 5.0%, a difference of 12.4%.
Professional Degree Correlation Summary
| Measurement | Irish | Immigrants from Morocco |
| Minimum | 1.5% | 0.78% |
| Maximum | 40.0% | 7.2% |
| Range | 38.5% | 6.4% |
| Mean | 7.0% | 4.0% |
| Median | 4.7% | 4.5% |
| Interquartile 25% (IQ1) | 4.0% | 2.2% |
| Interquartile 75% (IQ3) | 5.9% | 5.2% |
| Interquartile Range (IQR) | 1.9% | 3.0% |
| Standard Deviation (Sample) | 7.1% | 1.8% |
| Standard Deviation (Population) | 7.1% | 1.7% |
Similar Demographics by Professional Degree
Demographics Similar to Irish by Professional Degree
In terms of professional degree, the demographic groups most similar to Irish are Kenyan (4.4%, a difference of 0.0%), English (4.4%, a difference of 0.020%), Immigrants from Peru (4.4%, a difference of 0.10%), Spaniard (4.4%, a difference of 0.30%), and Celtic (4.4%, a difference of 0.35%).
| Demographics | Rating | Rank | Professional Degree |
| Immigrants | Sierra Leone | 58.7 /100 | #168 | Average 4.5% |
| Chinese | 58.6 /100 | #169 | Average 4.5% |
| Immigrants | Zaire | 57.4 /100 | #170 | Average 4.5% |
| Immigrants | Bangladesh | 56.0 /100 | #171 | Average 4.4% |
| Spaniards | 52.0 /100 | #172 | Average 4.4% |
| English | 50.1 /100 | #173 | Average 4.4% |
| Kenyans | 50.0 /100 | #174 | Average 4.4% |
| Irish | 50.0 /100 | #175 | Average 4.4% |
| Immigrants | Peru | 49.3 /100 | #176 | Average 4.4% |
| Celtics | 47.6 /100 | #177 | Average 4.4% |
| Immigrants | Costa Rica | 46.7 /100 | #178 | Average 4.4% |
| Immigrants | Kenya | 45.9 /100 | #179 | Average 4.4% |
| Czechs | 44.9 /100 | #180 | Average 4.4% |
| Danes | 43.5 /100 | #181 | Average 4.4% |
| Immigrants | Immigrants | 43.2 /100 | #182 | Average 4.4% |
Demographics Similar to Immigrants from Morocco by Professional Degree
In terms of professional degree, the demographic groups most similar to Immigrants from Morocco are Moroccan (5.0%, a difference of 0.10%), Immigrants from Pakistan (5.0%, a difference of 0.45%), Taiwanese (5.0%, a difference of 0.47%), Venezuelan (4.9%, a difference of 0.57%), and Brazilian (5.0%, a difference of 0.69%).
| Demographics | Rating | Rank | Professional Degree |
| Maltese | 98.1 /100 | #107 | Exceptional 5.0% |
| Immigrants | Southern Europe | 98.1 /100 | #108 | Exceptional 5.0% |
| British | 98.0 /100 | #109 | Exceptional 5.0% |
| Lebanese | 98.0 /100 | #110 | Exceptional 5.0% |
| Brazilians | 97.4 /100 | #111 | Exceptional 5.0% |
| Taiwanese | 97.3 /100 | #112 | Exceptional 5.0% |
| Immigrants | Pakistan | 97.2 /100 | #113 | Exceptional 5.0% |
| Immigrants | Morocco | 96.8 /100 | #114 | Exceptional 5.0% |
| Moroccans | 96.8 /100 | #115 | Exceptional 5.0% |
| Venezuelans | 96.3 /100 | #116 | Exceptional 4.9% |
| Immigrants | Syria | 96.0 /100 | #117 | Exceptional 4.9% |
| Croatians | 96.0 /100 | #118 | Exceptional 4.9% |
| Immigrants | Sudan | 95.4 /100 | #119 | Exceptional 4.9% |
| Albanians | 95.3 /100 | #120 | Exceptional 4.9% |
| Immigrants | Moldova | 94.8 /100 | #121 | Exceptional 4.9% |