Indonesian vs Immigrants from Eritrea College, 1 year or more
COMPARE
Indonesian
Immigrants from Eritrea
College, 1 year or more
College, 1 year or more Comparison
Indonesians
Immigrants from Eritrea
55.1%
COLLEGE, 1 YEAR OR MORE
0.4/ 100
METRIC RATING
257th/ 347
METRIC RANK
60.7%
COLLEGE, 1 YEAR OR MORE
84.3/ 100
METRIC RATING
139th/ 347
METRIC RANK
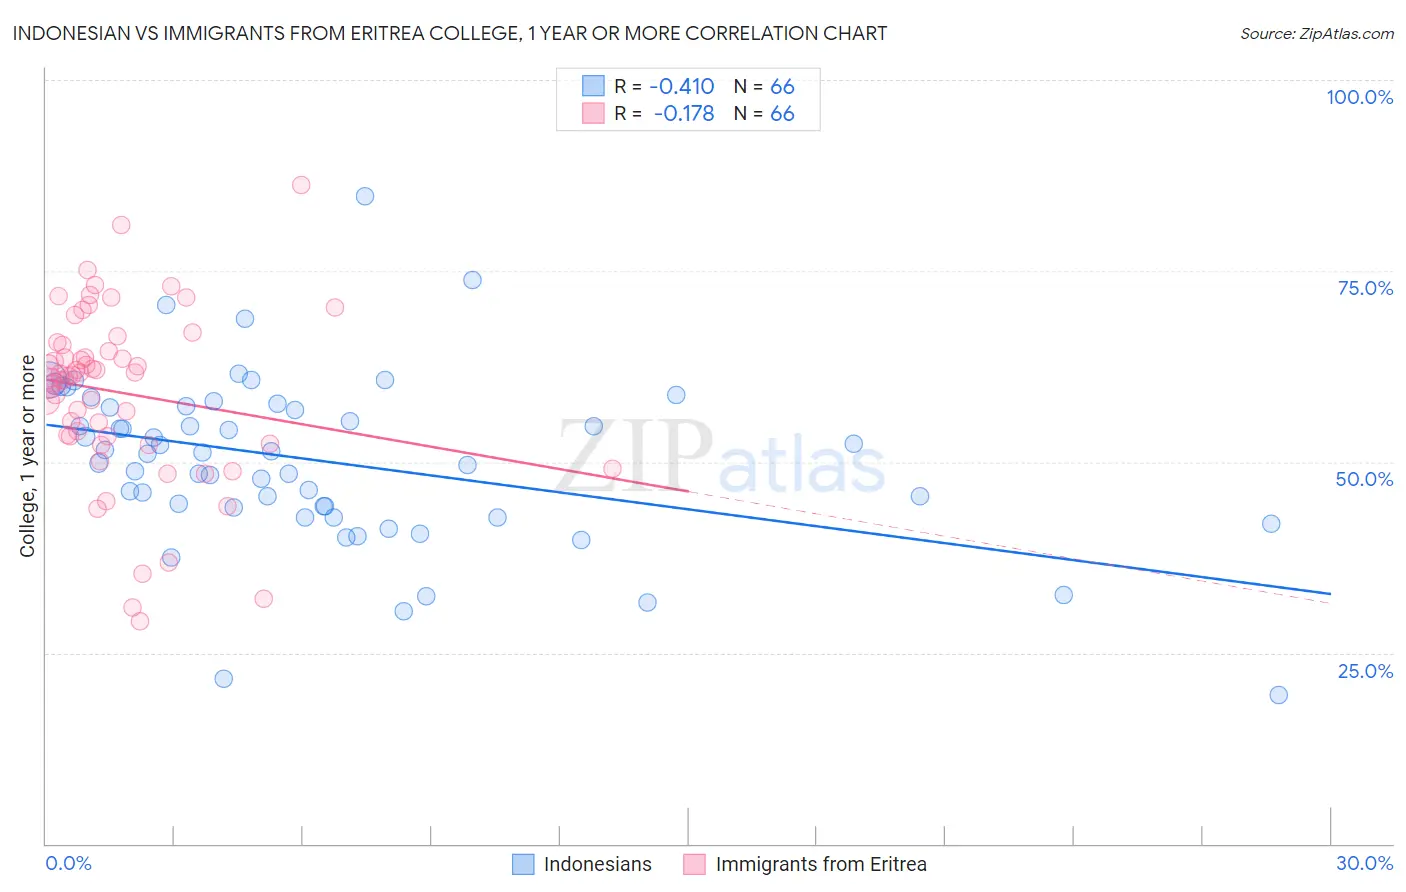
Indonesian vs Immigrants from Eritrea College, 1 year or more Correlation Chart
The statistical analysis conducted on geographies consisting of 162,727,113 people shows a moderate negative correlation between the proportion of Indonesians and percentage of population with at least college, 1 year or more education in the United States with a correlation coefficient (R) of -0.410 and weighted average of 55.1%. Similarly, the statistical analysis conducted on geographies consisting of 104,852,788 people shows a poor negative correlation between the proportion of Immigrants from Eritrea and percentage of population with at least college, 1 year or more education in the United States with a correlation coefficient (R) of -0.178 and weighted average of 60.7%, a difference of 10.2%.
College, 1 year or more Correlation Summary
| Measurement | Indonesian | Immigrants from Eritrea |
| Minimum | 19.4% | 29.1% |
| Maximum | 84.8% | 86.2% |
| Range | 65.3% | 57.1% |
| Mean | 50.1% | 59.0% |
| Median | 51.1% | 61.3% |
| Interquartile 25% (IQ1) | 44.0% | 53.3% |
| Interquartile 75% (IQ3) | 57.3% | 65.3% |
| Interquartile Range (IQR) | 13.3% | 12.0% |
| Standard Deviation (Sample) | 11.2% | 11.3% |
| Standard Deviation (Population) | 11.1% | 11.3% |
Similar Demographics by College, 1 year or more
Demographics Similar to Indonesians by College, 1 year or more
In terms of college, 1 year or more, the demographic groups most similar to Indonesians are Immigrants from West Indies (55.2%, a difference of 0.10%), Immigrants from Bahamas (55.2%, a difference of 0.17%), Japanese (55.2%, a difference of 0.22%), African (55.0%, a difference of 0.28%), and Nepalese (54.9%, a difference of 0.34%).
| Demographics | Rating | Rank | College, 1 year or more |
| Delaware | 0.7 /100 | #250 | Tragic 55.5% |
| Immigrants | Cambodia | 0.6 /100 | #251 | Tragic 55.4% |
| Aleuts | 0.6 /100 | #252 | Tragic 55.4% |
| Immigrants | Barbados | 0.6 /100 | #253 | Tragic 55.4% |
| Japanese | 0.5 /100 | #254 | Tragic 55.2% |
| Immigrants | Bahamas | 0.5 /100 | #255 | Tragic 55.2% |
| Immigrants | West Indies | 0.5 /100 | #256 | Tragic 55.2% |
| Indonesians | 0.4 /100 | #257 | Tragic 55.1% |
| Africans | 0.4 /100 | #258 | Tragic 55.0% |
| Nepalese | 0.3 /100 | #259 | Tragic 54.9% |
| Jamaicans | 0.3 /100 | #260 | Tragic 54.9% |
| Ottawa | 0.3 /100 | #261 | Tragic 54.9% |
| Immigrants | St. Vincent and the Grenadines | 0.3 /100 | #262 | Tragic 54.8% |
| U.S. Virgin Islanders | 0.3 /100 | #263 | Tragic 54.8% |
| Immigrants | Micronesia | 0.3 /100 | #264 | Tragic 54.8% |
Demographics Similar to Immigrants from Eritrea by College, 1 year or more
In terms of college, 1 year or more, the demographic groups most similar to Immigrants from Eritrea are Taiwanese (60.7%, a difference of 0.0%), Iraqi (60.7%, a difference of 0.090%), Immigrants from Afghanistan (60.7%, a difference of 0.11%), Polish (60.7%, a difference of 0.14%), and Canadian (60.6%, a difference of 0.15%).
| Demographics | Rating | Rank | College, 1 year or more |
| Scandinavians | 88.2 /100 | #132 | Excellent 61.0% |
| Immigrants | Uzbekistan | 88.0 /100 | #133 | Excellent 61.0% |
| Immigrants | Venezuela | 87.9 /100 | #134 | Excellent 61.0% |
| Immigrants | Uganda | 87.4 /100 | #135 | Excellent 60.9% |
| Basques | 87.2 /100 | #136 | Excellent 60.9% |
| Slovenes | 86.5 /100 | #137 | Excellent 60.9% |
| Taiwanese | 84.3 /100 | #138 | Excellent 60.7% |
| Immigrants | Eritrea | 84.3 /100 | #139 | Excellent 60.7% |
| Iraqis | 83.3 /100 | #140 | Excellent 60.7% |
| Immigrants | Afghanistan | 83.1 /100 | #141 | Excellent 60.7% |
| Poles | 82.8 /100 | #142 | Excellent 60.7% |
| Canadians | 82.7 /100 | #143 | Excellent 60.6% |
| Czechs | 81.9 /100 | #144 | Excellent 60.6% |
| Slavs | 81.1 /100 | #145 | Excellent 60.6% |
| Scottish | 80.2 /100 | #146 | Excellent 60.5% |