Tlingit-Haida vs Immigrants from France College, 1 year or more
COMPARE
Tlingit-Haida
Immigrants from France
College, 1 year or more
College, 1 year or more Comparison
Tlingit-Haida
Immigrants from France
59.4%
COLLEGE, 1 YEAR OR MORE
48.4/ 100
METRIC RATING
177th/ 347
METRIC RANK
65.8%
COLLEGE, 1 YEAR OR MORE
100.0/ 100
METRIC RATING
28th/ 347
METRIC RANK
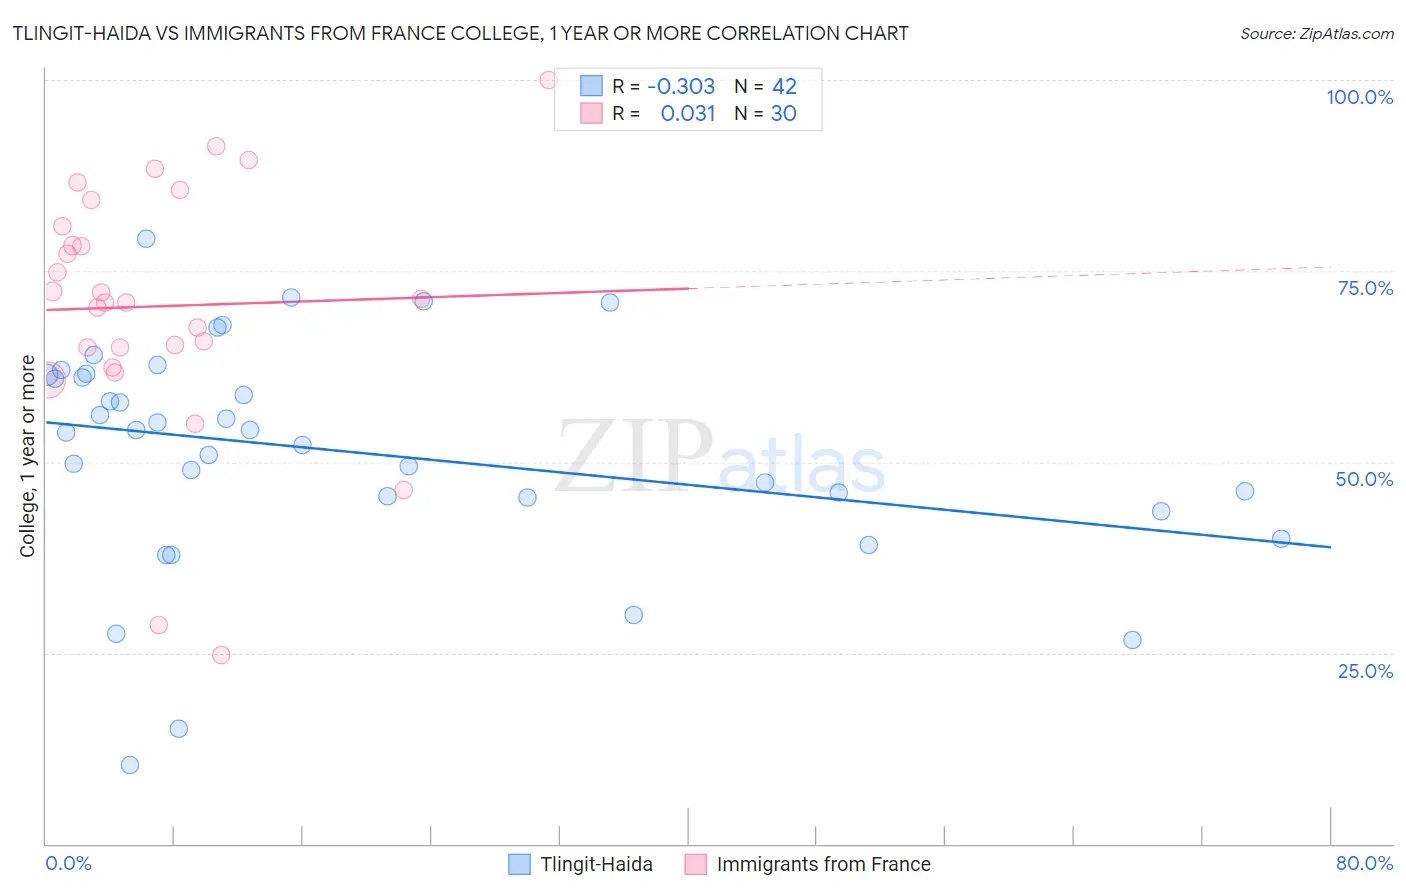
Tlingit-Haida vs Immigrants from France College, 1 year or more Correlation Chart
The statistical analysis conducted on geographies consisting of 60,872,339 people shows a mild negative correlation between the proportion of Tlingit-Haida and percentage of population with at least college, 1 year or more education in the United States with a correlation coefficient (R) of -0.303 and weighted average of 59.4%. Similarly, the statistical analysis conducted on geographies consisting of 287,918,860 people shows no correlation between the proportion of Immigrants from France and percentage of population with at least college, 1 year or more education in the United States with a correlation coefficient (R) of 0.031 and weighted average of 65.8%, a difference of 10.9%.
College, 1 year or more Correlation Summary
| Measurement | Tlingit-Haida | Immigrants from France |
| Minimum | 10.3% | 24.7% |
| Maximum | 79.3% | 100.0% |
| Range | 69.0% | 75.3% |
| Mean | 51.3% | 70.4% |
| Median | 54.0% | 71.2% |
| Interquartile 25% (IQ1) | 45.3% | 64.9% |
| Interquartile 75% (IQ3) | 61.5% | 80.9% |
| Interquartile Range (IQR) | 16.1% | 16.0% |
| Standard Deviation (Sample) | 14.8% | 16.6% |
| Standard Deviation (Population) | 14.6% | 16.3% |
Similar Demographics by College, 1 year or more
Demographics Similar to Tlingit-Haida by College, 1 year or more
In terms of college, 1 year or more, the demographic groups most similar to Tlingit-Haida are Czechoslovakian (59.4%, a difference of 0.0%), Sri Lankan (59.4%, a difference of 0.030%), Immigrants from Poland (59.4%, a difference of 0.030%), Celtic (59.4%, a difference of 0.080%), and Bermudan (59.3%, a difference of 0.10%).
| Demographics | Rating | Rank | College, 1 year or more |
| Welsh | 52.4 /100 | #170 | Average 59.5% |
| Immigrants | Albania | 52.3 /100 | #171 | Average 59.5% |
| Immigrants | Sierra Leone | 52.2 /100 | #172 | Average 59.5% |
| Immigrants | Oceania | 51.2 /100 | #173 | Average 59.4% |
| Celtics | 50.0 /100 | #174 | Average 59.4% |
| Sri Lankans | 49.0 /100 | #175 | Average 59.4% |
| Immigrants | Poland | 48.9 /100 | #176 | Average 59.4% |
| Tlingit-Haida | 48.4 /100 | #177 | Average 59.4% |
| Czechoslovakians | 48.3 /100 | #178 | Average 59.4% |
| Bermudans | 46.6 /100 | #179 | Average 59.3% |
| Yugoslavians | 44.1 /100 | #180 | Average 59.2% |
| Swiss | 43.4 /100 | #181 | Average 59.2% |
| Immigrants | Bosnia and Herzegovina | 42.8 /100 | #182 | Average 59.2% |
| German Russians | 39.3 /100 | #183 | Fair 59.1% |
| Spaniards | 38.3 /100 | #184 | Fair 59.0% |
Demographics Similar to Immigrants from France by College, 1 year or more
In terms of college, 1 year or more, the demographic groups most similar to Immigrants from France are Immigrants from Ireland (65.9%, a difference of 0.17%), Immigrants from Northern Europe (65.6%, a difference of 0.25%), Immigrants from Denmark (65.6%, a difference of 0.36%), Latvian (66.1%, a difference of 0.37%), and Indian (Asian) (66.1%, a difference of 0.41%).
| Demographics | Rating | Rank | College, 1 year or more |
| Immigrants | Hong Kong | 100.0 /100 | #21 | Exceptional 66.4% |
| Soviet Union | 100.0 /100 | #22 | Exceptional 66.4% |
| Immigrants | China | 100.0 /100 | #23 | Exceptional 66.4% |
| Immigrants | Belgium | 100.0 /100 | #24 | Exceptional 66.3% |
| Indians (Asian) | 100.0 /100 | #25 | Exceptional 66.1% |
| Latvians | 100.0 /100 | #26 | Exceptional 66.1% |
| Immigrants | Ireland | 100.0 /100 | #27 | Exceptional 65.9% |
| Immigrants | France | 100.0 /100 | #28 | Exceptional 65.8% |
| Immigrants | Northern Europe | 100.0 /100 | #29 | Exceptional 65.6% |
| Immigrants | Denmark | 100.0 /100 | #30 | Exceptional 65.6% |
| Turks | 100.0 /100 | #31 | Exceptional 65.5% |
| Bulgarians | 100.0 /100 | #32 | Exceptional 65.5% |
| Immigrants | Sri Lanka | 99.9 /100 | #33 | Exceptional 65.4% |
| Israelis | 99.9 /100 | #34 | Exceptional 65.3% |
| Immigrants | Turkey | 99.9 /100 | #35 | Exceptional 65.2% |